

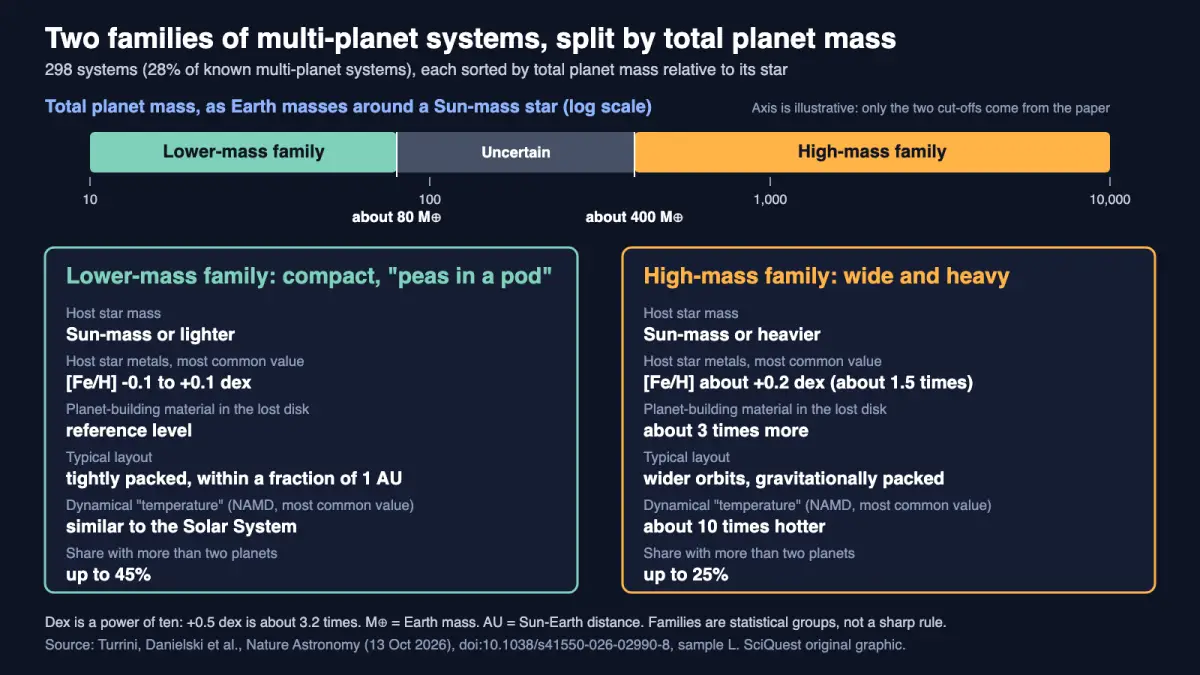
Systems in the high-mass family are about ten times more dynamically excited than the Solar System and circle more metal-rich stars, but the split partly follows which planets today’s telescopes can find.
Peer reviewed · Population study of catalogue data · Simulations
An international team led by Italy’s National Institute for Astrophysics (INAF) has sorted 298 known multi-planet systems into two groups by their total planet mass: compact, lower-mass systems and wide, high-mass ones. The two groups also differ in their stars. Lower-mass systems mostly circle stars as light as the Sun or lighter, while high-mass systems favour stars as heavy as the Sun or heavier, and richer in metals. The paper appeared in Nature Astronomy on 13 October 2026. It reports a statistical link, not a proven cause, and part of the split reflects what telescopes can detect.
What you need to know
- Finding: Multi-planet systems fall into a lower-mass family (below roughly 80 Earth masses of planets around a Sun-like star) and a high-mass family (above roughly 400), with host stars that differ in mass and metal content.
- Method: The team took planet data from the NASA Exoplanet Archive, built four overlapping samples (298, 189, 89 and 68 systems), computed nine uniform metrics, split the systems with a two-component Gaussian mixture on one mass metric, and ran instability simulations.
- Source: Turrini, Danielski and ten co-authors, Nature Astronomy, 13 October 2026 (open access).
- Why it matters: It argues that a star’s mass and metal content help set what kind of planetary system forms, so the Solar System is a poor template for every other star.
- Limitation: Transit and radial velocity surveys find compact and massive systems far more easily than wide, lighter ones, so the paper itself says the true trend is probably more complex.
Evidence at a glance
| Item | Assessment |
|---|---|
| Evidence status | Peer reviewed; statistical population study of existing catalogue data (no new observations) plus exploratory computer simulations. |
| Primary source | “Two families of multi-planet systems with distinct architectures and stellar hosts”, Nature Astronomy, published online 13 October 2026, doi:10.1038/s41550-026-02990-8, CC BY. The four samples are on Zenodo. |
| Evidence strength | Moderate for the existence of two statistically distinct groups: the split held in all four samples and survived tests that correct for multiple comparisons. Limited for the cause: the link to host stars is an association, the formation story is an interpretation, and the simulations are exploratory. |
| Principal limitation | Detection bias. The families line up with the two main groups of known exoplanets, found by transits (short orbits) and radial velocity (heavier, wider planets), and the paper says the true trend is probably more complex because wide, intermediate-mass systems remain undiscovered. |
| Coverage at a glance | 3 distinct credible publishers with their own write-ups (Space.com, Universe Today, EarthSky) as of 17 October 2026, 15:07 UTC. Not counted: INAF’s own release, its wire copy, and rewrites of other outlets’ stories (for example bdnews24, which restates Space.com’s report). |
Sources: the paper and its Methods, the INAF release, and a SciQuest search of news coverage.
Is this a big deal?
A solid, useful step in classifying planetary systems, not a rewrite of planet formation. Compact “peas-in-a-pod” systems and rough, massive ones were already known. What is new is a uniform comparison across four samples, and evidence that the two groups sit around different kinds of stars. INAF’s release says the study demonstrates the star-planet link “for the first time”. The paper’s own wording is more careful: the differences “can be explained by” the interplay of formation and host star.
What scientists found
When the team plotted the normalised system mass, meaning total planet mass divided by the star’s mass, the 298 systems formed two humps rather than one smooth spread. The paper’s boundaries are a log10 value below -3.602 for the lower-mass family and above -2.927 for the high-mass family. Around a Sun-mass star, that works out to about 80 Earth masses or less, and about 400 Earth masses or more (roughly 1.3 Jupiter masses). Systems in between are labelled uncertain and were left out of the comparisons.
The host stars differ. Lower-mass systems mostly orbit stars of solar or subsolar mass, with a most common metallicity between -0.1 and +0.1 dex (dex is a power of ten, so 0 matches the Sun). High-mass systems orbit solar-to-supersolar stars whose most common metallicity is about +0.2 dex, roughly 1.5 times the Sun’s iron-to-hydrogen ratio. Combining stellar mass and metallicity, the authors estimate that the discs that formed high-mass systems held about three times more solids.
The layouts differ too. Lower-mass systems are mostly tight, spanning a fraction of an astronomical unit (the Sun-Earth distance). Systems with more than two planets reach up to 45% of this family (up to 25% in the high-mass one), so both are mostly two-planet systems. In most of them the biggest planet holds a third to two-thirds of the planetary mass, which fits the peas-in-a-pod pattern first seen among Kepler’s transiting planets. High-mass systems show no such pattern: the biggest planet holds anywhere from half the mass to nearly all of it. They are also about ten times more dynamically excited, a sign, the authors write, of violent histories with instabilities and planet-planet scattering.
How they found it
The data are public. The team queried the NASA Exoplanet Archive on 14 October 2025 for systems around single stars, with mass and orbital distance measured for every planet, and excluded binary stars and disputed planets. That gave the 298-system reference sample, about 28% of known multi-planet systems. Three subsets checked the result: 189 systems with homogeneously measured stars, 89 with measured eccentricities for every planet, and 68 with true (not minimum) masses.
The split itself is a modest piece of statistics. A two-component Gaussian mixture, a standard tool for finding humps in a distribution, was fitted to the normalised mass alone. The authors then tested every other metric (spacing, multiplicity, outer-planet period, dynamical excitation and the host star’s mass and metallicity) for differences between the families, using Kolmogorov-Smirnov tests corrected for multiple comparisons, plus resampling tests that account for measurement error. Across all metrics and samples, the weakest result still had a P value of about 0.02 (multiplicity in the 89-system sample).
Finally, they ran instability simulations from four starting states: unstable non-resonant systems, incomplete resonant chains, and two stable setups disturbed by passing stars. Starting from unstable setups came closest to the observed excitation, and the stable starts did not. INAF’s release adds that, for the high-mass family, the best-fitting simulations are those unstable from birth, with planet-rich discs producing planets too large for a stable system. That is a model result, not an observation.
Why it matters to you
Nothing changes in daily life this year. The practical effect is on how astronomers read other planetary systems: if a star’s mass and metals help set its planets’ layout, then the Sun’s system is one outcome among several and should not serve as the default template, which is the paper’s own conclusion. The INAF release adds that this could guide the search for Earth-like worlds. The paper itself does not test habitability, so treat that as the team’s outlook, not a result.
What the evidence does not show
Think of fishing with two nets of different mesh. One catches small fish close to the boat and the other catches only large fish far out, so the haul falls into two piles even if the lake holds a smooth range of sizes. Transit surveys play the first role and radial velocity surveys the second. The authors know this: they note that the mass and period humps are “probably connected through observational biases” and so focus on the mass split alone, then argue that the host-star differences show the groups are physically distinct. The analogy has a limit: the authors did not stop at the nets, since they also compared host stars. Still, no statistical test can fully remove a detection filter that shaped the catalogue.
Several other limits matter. Some planet masses are minimum masses from radial velocity, which depend on an unknown orbital tilt. In the 298-system sample, most eccentricity values are estimated from a relation found in Kepler systems, and measured relative tilts exist for only a handful of systems. The dynamical-excitation values for that sample are therefore partly modelled. Finally, “genetic link” is the team’s name for a correlation across systems. It does not show that stellar mass or metals cause a given architecture, since other factors, such as the star’s birth environment, could shape both.
How this fits what we already knew
The paper builds on population studies of Kepler planets, including the 2018 California-Kepler Survey result that planets within a system tend to be similar in size and evenly spaced. The finding that high-excitation systems tend to have fewer planets agrees with earlier work. New is the two-hump split in normalised mass and its tie to host stars. For wider background on how many worlds are known, see how many planets are there in the Milky Way, and for why a star’s mass sets its life, the stages of the life cycle of a star.
Independent perspective
SciQuest found no published comment from an astronomer outside the research team as of 15:07 UTC on 17 October 2026, and has not yet interviewed one. The strongest outside check available is the paper’s own self-critique: it flags observational bias, the filled-in eccentricities and the possibility of undiscovered wide, intermediate-mass systems.
How other headlines framed it
- Space.com, judging by its headline, chose an ancestry metaphor, “planetary genealogy”, with planets belonging to one of two families.
- Universe Today framed the host star as the active party, with stars shaping their systems, and gave more space to the sample and the “hot” versus “cold” excitation.
- EarthSky gave a plain-language profile of each family. It credits the work to the International Space Science Institute, which funded the project; the lead institute is INAF.
Two of these framings, “stars shape” and “tend to form”, read as cause, which the correlation does not establish. Universe Today and EarthSky both relay the team’s check on whether the families are an artefact of selection effects.
What happens next
Two things would test the result. Surveys that reach wide, lighter systems, such as long-baseline radial velocity and astrometry, could fill the empty middle and show whether the two humps stay separate or blur into one. Measured eccentricities and orbital tilts for more systems would replace the modelled values. The paper also notes that the part of the mass-period plot where hot Jupiters sit is visibly underpopulated by its systems. A related read: JWST maps the atmosphere of the hot Jupiter WASP-17b.
In one sentence
Known multi-planet systems split into a compact lower-mass family and a wide high-mass family that sit around different kinds of stars, but because telescopes favour certain systems, the link remains a correlation until wider surveys fill in the middle.
Quick check: did it click?
- How were the two families defined? By total planet mass divided by star mass, using a two-component Gaussian mixture; below about 80 or above about 400 Earth masses around a Sun-mass star, with an uncertain zone between.
- Why can’t we say the stars cause the families? The groups match what transit and radial velocity surveys can detect, many eccentricities were estimated, and the link is a statistical association.
- Which family is about ten times more dynamically excited than the Solar System? The high-mass family, around Sun-mass or heavier, more metal-rich stars.
Read next
- How many planets are there in the Milky Way? The scale of the catalogue this study draws on.
- How many Goldilocks planets have been discovered so far? Where habitability enters the story.
- JWST maps WASP-17b’s atmosphere, a close look at a hot Jupiter.
Sources and disclosure
- Turrini D, Danielski C, Polychroni D, Przyłuski R, Rickman H, Bossini D, Kruijssen JMD, Zinzi A, Goodwin S, Longmore SN, Chevance M, Ramambason L. “Two families of multi-planet systems with distinct architectures and stellar hosts.” Nature Astronomy, published 13 October 2026. doi:10.1038/s41550-026-02990-8
- Turrini D, Danielski C. Multi-criteria samples of architecturally-characterized multi-planet systems. Zenodo (2026).
- INAF, Media INAF. “Tranquilli o turbolenti? Dipende dalla stella madre.” 13 October 2026.
- Weiss LM et al. “The California-Kepler Survey. V. Peas in a pod.” Astronomical Journal 155, 48 (2018). doi:10.3847/1538-3881/aa9ff6
- Coverage read for framing: Space.com, Universe Today, EarthSky.
Disclosure: This article was drafted with AI assistance and checked against the sources above, including the full open-access paper. The authors declare no competing interests; the work was supported by the International Space Science Institute, the Italian Space Agency and INAF. Calculations by SciQuest: the paper’s log10 cut-offs of -3.602 and -2.927 convert to about 84 and 393 Earth masses for a Sun-mass star (the paper rounds to 80 and 400); 400 Earth masses is about 1.3 Jupiter masses; +0.5 dex is a factor of about 3.2. The graphic is a SciQuest original built from the paper’s reported values. Spotted an error? See our corrections policy.
Discover more from SciQuest
Subscribe to get the latest posts sent to your email.
Leave a comment