

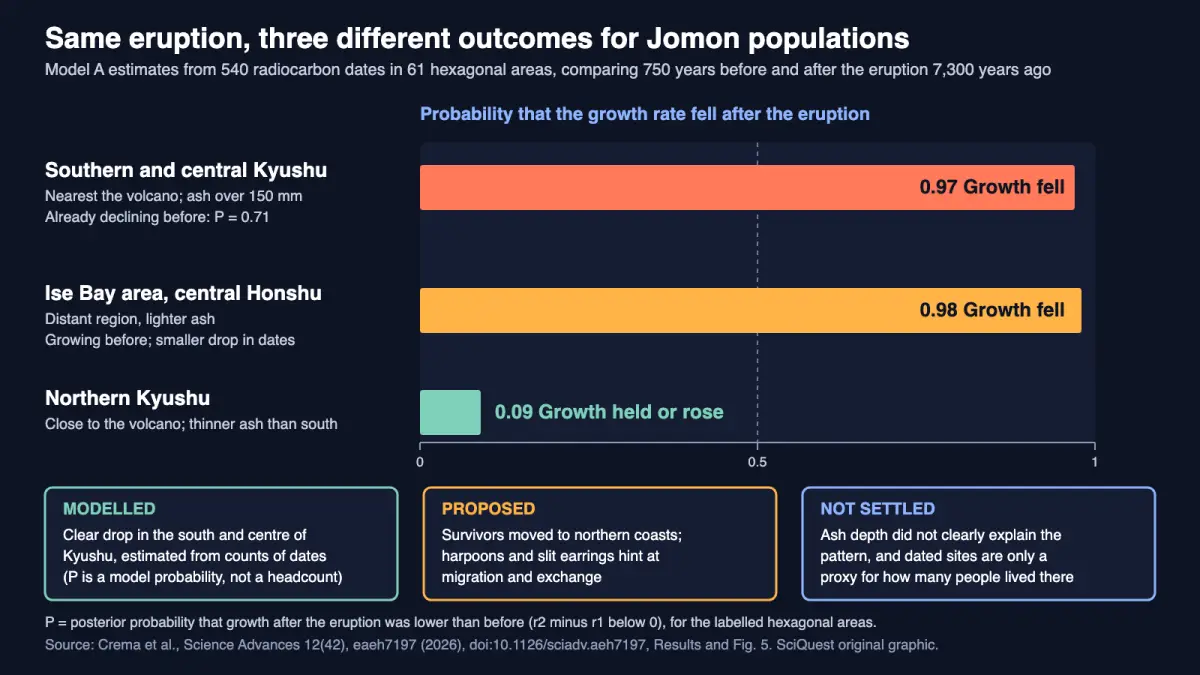
Date counts point to a steep drop after the eruption across southern and central Kyushu and continued growth in northern Kyushu, but dated sites are only a stand-in for people.
Peer reviewed · Statistical model of radiocarbon dates · Archaeological interpretation
A new analysis of 540 radiocarbon dates suggests the Kikai-Akahoya eruption, which blew out of a caldera about 30 km south of Kyushu 7,300 years ago, hit Japan’s Jomon hunter-gatherers very unevenly. Date counts fell sharply in southern and central Kyushu, kept rising in northern Kyushu, and weakened in some distant regions. The team, led from Cambridge and Lund with colleagues in Japan, Finland and Denmark, published it in Science Advances on 16 October 2026. It counts dated sites, not people, so the migration story remains a hypothesis.
What you need to know
- Finding: After the eruption, the model puts about 97% probability on a falling growth rate in southern and central Kyushu, while northern Kyushu and parts of Honshu’s northern coast held steady or grew.
- Method: Bayesian models of radiocarbon-date frequency in 61 hexagonal areas, comparing the 750 years before the eruption with the 750 years after, plus ash thickness and archaeological finds.
- Source: Crema, Kuwahata, Uchiyama, Junno, Riede and Jordan, Science Advances 12(42), 16 October 2026 (open access).
- Why it matters: It replaces a long-running “collapse versus survival” argument with a map of outcomes that varied by region and by what each place was doing before the eruption.
- Limitation: Radiocarbon-date counts are an indirect proxy for population, and several regions have too few dates to tell growth from decline.
Evidence at a glance
| Item | Assessment |
|---|---|
| Evidence status | Peer reviewed; statistical model of existing radiocarbon data (no new excavation), combined with archaeological interpretation. |
| Primary source | “Divergent demographic responses to the Kikai-Akahoya volcanic catastrophe in mid-Holocene Japan”, Science Advances 12(42), eaeh7197, published 16 October 2026, doi:10.1126/sciadv.aeh7197, CC BY 4.0. SciQuest read the full open-access text via PubMed Central. |
| Evidence strength | Moderate for a sharp decline in southern and central Kyushu, because the model gives about 0.97 to 0.98 probability and the pattern survived narrower time windows. Limited for the reasons behind the other patterns: migration, maritime growth and distant declines are proposals, and ash depth did not explain the results conclusively. |
| Principal limitation | The study counts radiocarbon dates, which stand in for population. Ash can bury sites, survivors may have moved to places that are less excavated, and the paper itself calls the data resolution low. |
| Coverage at a glance | 2 distinct credible publishers with their own write-ups (IFLScience, The Brighter Side of News) as of 19 October 2026, 13:25 UTC. Not counted: Lund University’s release, copies of it (EurekAlert, Phys.org, ScienceDaily, judging by matching headlines and text), and Archaeology News Online Magazine, which restates the release. |
Sources: the paper, the Lund University release, and a SciQuest search of news coverage on 19 October 2026.
Is this a big deal?
A solid step on a debate that has run for decades, not a final answer. Archaeologists had argued over a “Jomon Apocalypse” in the south versus local survival. What is new is a single archipelago-wide model, built from one dataset, that tests both ideas at once and finds each partly right. The authors call their results preliminary, and the strongest claims sit in the south, where the model is most certain.
What scientists found
The eruption’s effects depended on where you stood and where you had been heading. Southern and central Kyushu show the largest fall. The model’s probability that growth was lower after the eruption than before is about 0.97, and the south was probably already shrinking: the chance that its growth rate was below zero in the preceding 750 years is about 0.71. The authors read this as an eruption that accelerated a decline already under way.
Northern Kyushu went the other way. Its growth rate after the eruption looks similar to or higher than before, with only about a 0.09 probability that it fell. The same holds along the northern coast of western Honshu, in the Shimane and Tottori areas. Far away, the Ise Bay area on central Honshu shifted from growth to decline, with about 0.98 probability that growth fell. That drop was smaller than in the south, in a region not traditionally linked to this eruption’s impacts.
| Region | Result | Model probability | Status |
|---|---|---|---|
| Southern and central Kyushu | Largest decline in dates; decline may have started earlier | 0.97 that growth fell; 0.71 that growth was already below zero before | Modelled estimate; abandonment in places is the authors’ reading |
| Ise Bay area (central Honshu) | Shift from growth to decline, smaller than in the south | 0.98 that growth fell | Modelled estimate; cause unknown |
| Northern Kyushu | Growth continued, possibly speeding up | 0.09 that growth fell | Modelled estimate; whether date density changed is unclear |
| Northern coast of western Honshu (Shimane, Tottori) | Growth maintained | Below 0.11 that growth was negative after | Modelled estimate; links to migration are proposed |
Source: Crema et al., Science Advances (2026), Results. “Model probability” is the model’s own estimate given the data and its assumptions, not a head count of people. Growth here means growth in the frequency of radiocarbon dates.
How they found it
Radiocarbon dating gives an age to a piece of organic material, such as a burned seed or a bone. Count the dates across a region and, with care, their rise and fall tracks how much human activity it saw. The team started with more than 42,000 dates in the National Museum of Japanese History database, kept those on land-derived material that fall between 8,000 and 6,500 years ago, and merged near-duplicates (samples within 100 m and 100 years of each other). That left 540 dates, about 1.3% of the starting pool. Two test subsets (371 and 703 dates) checked that the choices did not drive the results.
They split Japan’s four main islands into 61 hexagons, each 125 km across, and fitted two Bayesian models. Model A estimates growth rates before and after the eruption. Model B asks what share of a hexagon’s dates fall after it. Neighbouring hexagons share information, which steadies estimates where dates are scarce, and the models carry that uncertainty forward instead of hiding it. Finally the team tested whether average ash thickness explained the pattern, then set the results beside pottery, tools and settlement evidence.
The ash itself is the second line of evidence. The eruption was rated VEI 7 and spread an estimated 332 to 457 km³ of bulk tephra (volcanic ash and pumice), the volume of a cube roughly 7 to 8 km on each side, as a geometric comparison. Ash reached 1,000 to 2,000 mm (1 to 2 m) at Kyushu’s southern tip, 25 to 150 mm across much of western Japan, and under 25 mm in northern Tohoku and Hokkaido.
Where the archaeology can be read directly, it fits the model. At Numerikawa No. 2 in southern Kyushu, the post-eruption “survivor” pottery is missing above the ash, which the authors take to mean nobody sheltered there. Before the eruption, 84 of 107 obsidian artefacts at the site came from northern Kyushu sources more than 200 km away; after people returned, all 27 did. Meanwhile slit stone earrings, found only in the south before the eruption, show up at northern coastal sites afterwards, and stone harpoon tips become more numerous and spread to the Goto Islands, 40 to 80 km offshore. The authors treat these as preliminary support for northward movement and a shift to the sea.
Why it matters to you
There is no near-term effect, and an eruption of this size is very rare. The practical lesson is about reading disasters. “Collapse” and “survival” were both too simple: the same ash fall left a thin, mobile population in the south with little to lose, a growing coastal population in the north, and a quiet slowdown in places far from the volcano. How a community fared depended partly on what it was already doing. For what drives eruptions, see what triggers volcanic eruptions, and for a modern giant, Mauna Loa, the largest active volcano.
What the evidence does not show
Dates are not people. The authors warn that people may have moved to places that are excavated less often, and that thick ash can hide sites today, so a gap in dates is not automatically a gap in population. In several regions the uncertainty is so wide that the model cannot say whether growth was positive or negative. For northern Kyushu, the paper notes the range is too wide to tell whether the overall density of dates changed.
Ash depth, the obvious suspect, did not settle it. There was no clear link between ash and growth in thinly covered areas, and only a weak negative link above a threshold of roughly 70 to 150 mm. Model comparisons gave no stronger support for including ash, and the paper puts that down partly to limited statistical power. The migration story is also inferred. Spreading earrings and harpoons are consistent with people moving, but artefacts can travel by exchange alone.
The distant slowdowns have no tested cause. The authors list three possibilities, fluoride poisoning, fine ash harming lungs, and faster tooth wear in deer and wild boar that grazed on ash, and say confirming any of them would need bone and tooth analysis. Lund’s release adds short-term climate change as a possible factor. All of these are hypotheses.
How this fits what we already knew
The old “Jomon Apocalypse” view held that the eruption wiped out large villages in southern Kyushu and moved Jomon culture’s centre east. The paper partly supports it for southern and central Kyushu, the remote southern islands and possibly parts of Shikoku. But the large southern villages, it notes, had been abandoned several millennia earlier, so the eruption did not strike a static baseline. The newer “survival” view rests on pottery that continues through the ash. That survives too, but the authors argue small survivors may have left later. Neither story, they conclude, fits everything. For another archaeological case where interpretation outruns the data, see the 6,500-year-old Czech enclosure.
Independent perspective
SciQuest found no comment from an archaeologist outside the research team as of 13:25 UTC on 19 October 2026, and has not interviewed one. The strongest outside check available is the paper itself, which names its limits and carries a note thanking the editor and reviewers. Lund’s release quotes lead author Enrico Crema as saying the disaster caused major loss of life and senior author Peter Jordan as calling the eruption devastating, with little warning.
How other headlines framed it
- IFLScience led with the drama of near-annihilation and survival against the odds, and gave the most space to individual sites and finds.
- The Brighter Side of News framed it as a two-sided result, collapse in some places and coastal growth in others, and covered the hexagon method and time windows in more detail.
- ScienceDaily reposted Lund’s release under a “surprising twist” headline that stresses novelty over the evidence.
The “almost annihilated” framing fits the south but not the north. The paper’s own point is that outcomes diverged, and “survived” understates how large the southern decline appears to be.
What happens next
The authors set out a research agenda rather than a conclusion. In Kyushu they want finer environmental records, evidence of how survivors fed themselves, and tests of whether the south was repopulated from the north. For the distant slowdowns, they point to bone and tooth studies along the ash path and to particle-size analysis of the ash. Reading the results alongside new site excavations in northern Kyushu would test the migration idea most directly.
In one sentence
Date counts suggest the 7,300-year-old Kikai-Akahoya eruption cut deeply into southern Kyushu while northern coasts kept growing, though the data are an indirect proxy and the reasons are still proposals.
Quick check: did it click?
- What does the study actually count? Radiocarbon dates, as a stand-in for population, in 61 hexagonal areas.
- Where did the model find the clearest decline? Southern and central Kyushu, about 0.97 probability that growth fell, in an area that was probably already shrinking.
- Why is the migration story still a hypothesis? It rests on artefacts such as earrings and harpoons and on date counts, which fit movement but do not prove it.
Read next
- What triggers volcanic eruptions? The physics behind a caldera-forming blast.
- What is the largest active volcano in the world? Scale for a living giant.
- Neanderthal wooden spears and a possible club survive as moulds in Spain. Another case of reading the past from sparse remains.
Sources and disclosure
- Crema ER, Kuwahata M, Uchiyama J, Junno A, Riede F, Jordan PD. “Divergent demographic responses to the Kikai-Akahoya volcanic catastrophe in mid-Holocene Japan.” Science Advances 12(42), eaeh7197, 16 October 2026. doi:10.1126/sciadv.aeh7197. Open-access full text: PMC13665937.
- Lund University. “How one of Earth’s worst volcanic disasters affected societies.” 14 October 2026.
- Coverage read for framing: IFLScience, The Brighter Side of News, ScienceDaily.
Disclosure: This article was drafted with AI assistance and checked against the sources above, including the full open-access paper. The authors declare no competing interests; the work was supported by the Swedish Research Council, JSPS KAKENHI and the European Research Council. Calculations by SciQuest: 540 of more than 42,000 dates is about 1.3%; 332 to 457 km³ equals a cube about 6.9 to 7.7 km on a side; the two 750-year windows span 1,500 years. The graphic is a SciQuest original built from probabilities reported in the paper. Spotted an error? See our corrections policy.
Discover more from SciQuest
Subscribe to get the latest posts sent to your email.
Leave a comment