

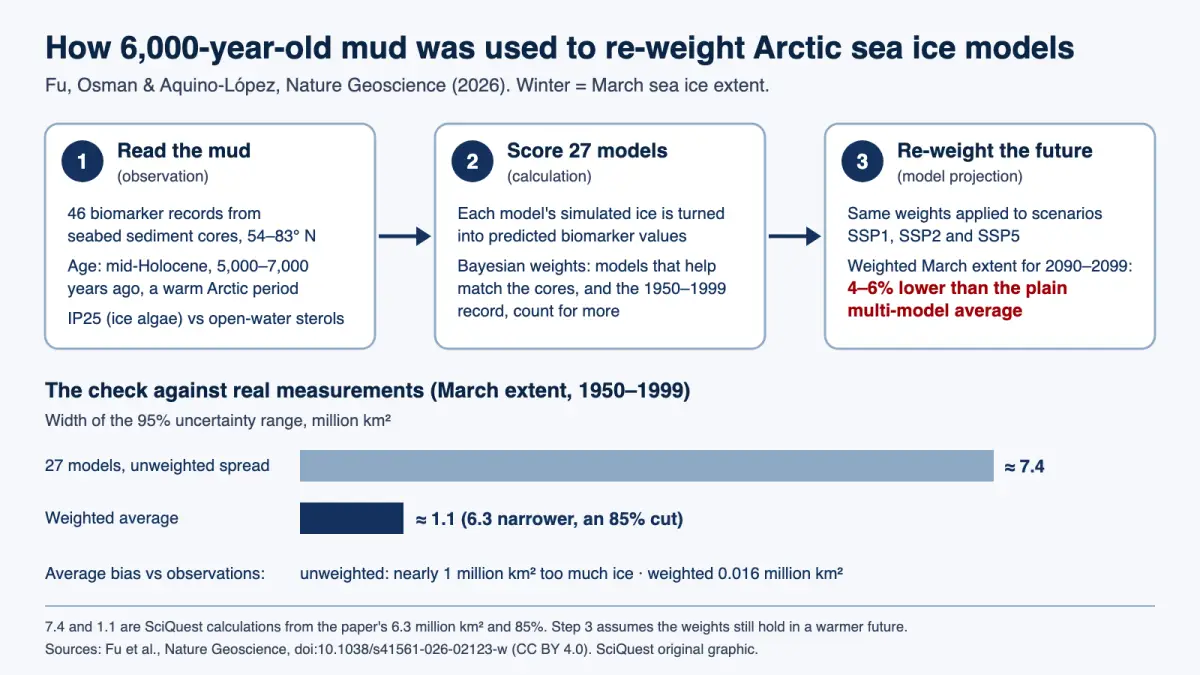
Weighting 27 climate models by how well they match 46 seabed records from a warm spell 5,000 to 7,000 years ago lowers projected March Arctic sea ice by nearly 1 million km² and removes a long-standing bias, but the future numbers rest on one method and an untested assumption.
Peer reviewed · Palaeoclimate proxy data · Climate model projections
Climate models may be giving the Arctic too much winter sea ice. Crystal Fu and Matthew Osman of the University of Cambridge and Marco Aquino-López of CIMAT in Mexico tested 27 models against chemical traces of sea ice in seabed mud from the mid-Holocene, a warm spell about 6,000 years ago. Weighting the models that best matched those traces and the 1950–1999 record cut projected March ice extent by nearly 1 million km². The study appeared in Nature Geoscience on 16 October 2026. Its future numbers are model projections that assume the weights still hold as the Arctic warms.
What you need to know
- Finding: A weighted average of 27 models puts future March Arctic sea ice extent nearly 1 million km² below the plain multi-model average, about 4–6% lower by 2090–2099, under low, middle and high emissions scenarios.
- Method: The team compiled 46 mid-Holocene biomarker records from sediment cores between about 54° N and 83° N, converted each model’s simulated ice into predicted biomarker values, and used Bayesian statistics to find the model weights that best reproduce the cores and the 1950–1999 record.
- Source: Fu, Osman and Aquino-López, Nature Geoscience, 16 October 2026 (open access), with a University of Cambridge release.
- Why it matters: Winter is the season in which climate models disagree most about Arctic ice, and winter ice controls how much heat and moisture the ocean releases to the air.
- Limitation: The weights were tested only against the past. Using them for 2100 assumes that models which matched the mid-Holocene and the late 20th century will stay the better guides in a warmer Arctic.
Evidence at a glance
| Item | Assessment |
|---|---|
| Evidence status | Peer reviewed. Combines measured biomarker data from sediment cores, satellite-era and historical ice observations, and computer model simulations. The headline numbers are weighted model projections, not observations. |
| Primary source | “Palaeoclimate constraints narrow uncertainty in future Arctic winter sea ice projections”, Nature Geoscience, published 16 October 2026, doi:10.1038/s41561-026-02123-w, CC BY 4.0. Data and code on GitHub and Zenodo. |
| Evidence strength | Moderate for the historical result: the weights were never shown total ice extent, yet the weighted average matched observed March extent from 1950–1999 almost exactly. Limited for the future numbers: one study, one weighting method, not yet repeated by other groups, and dependent on the weights holding in a warmer climate. |
| Principal limitation | The improvement is demonstrated on the past. No observation can yet confirm that the re-weighted projections for 2050 or 2100 are more accurate. |
| Coverage at a glance | 0 distinct credible publishers with their own reporting found as of 18 October 2026, 08:30 UTC. Not counted: four outlets that republish the University of Cambridge release (ECO Magazine, Eurasia Review and Mirage News carry its text; Phys.org runs it under a near-identical headline). |
Sources: the paper (main text, Methods and Extended Data legends), the University of Cambridge release and a SciQuest search of news coverage.
Is this a big deal?
It is a solid methodological step with a sobering direction, not a settled new forecast. Using ancient climate data to score models has mostly been qualitative until now, and this paper turns it into numbers with stated uncertainty. The result points one way under every scenario tested: less winter ice than the plain model average. But a single weighting study does not replace the full model ensemble, and other teams will need to test it.
What scientists found
The plain average of the 27 models has carried a persistent bias of nearly 1 million km² too much March ice compared with observations. With the weights applied, that bias in the 1950–1999 test shrank to 0.016 million km², an error of about 0.1%. The 95% uncertainty range for March extent narrowed by about 6.3 million km², which the authors give as 85% narrower than the spread across models.
For the future, the weighted average sits below the plain average under all three scenarios the team ran: SSP1, SSP2 and SSP5, which the paper describes as “sustainability”, “middle of the road” and “fossil-fuelled development”. For 2090–2099 the gap is about 4–6%. Under SSP5, the end-of-century uncertainty range tightens by more than 10 million km².
To put 1 million km² in scale, it is about 7% of the 14.29 million km² that the US National Snow and Ice Data Center (NSIDC) reported for the Arctic’s winter maximum on 15 March 2026. That 2026 peak was statistically tied with 2025’s record low of 14.31 million km², according to NSIDC.
The weighted maps also move the winter ice edge north by up to 5.5 degrees of latitude in the Barents, Greenland and Labrador Seas, roughly 600 km by SciQuest’s conversion. The paper notes that observed winter ice loss has also been most pronounced in the Barents Sea.
How they found it
The clues are molecules. Some algae that live in sea ice make a compound called IP25, and it settles into seabed mud. Open-water plankton make other compounds, sterols. Comparing the two, in an index called ln(PIP25), tells researchers how icy a site was, with a bias toward late winter and early spring, when ice is at its largest.
Fu compiled paired measurements from cores with direct age control, rebuilt their age models, and kept samples dated 5,000 to 7,000 years old. That gave 46 observations (27 using brassicasterol and 19 using dinosterol), which the authors call, to their knowledge, the largest compilation of its kind. The cores span 54.30° N to 82.58° N.
The models never output biomarkers, so the team ran each model’s simulated ice through BaySIC, a Bayesian calibration the same three authors published in 2025, to predict what each core should contain. A Bayesian scheme then searched for the set of weights that made the weighted prediction match the cores, starting from weights fitted to the 1950–1999 record. Models that tell the same story share weight, so near-copies do not count twice.
Think of 27 forecasters, each given a weight according to how well they called two seasons they had not been tuned to. The analogy has a limit: the paper warns that a high weight is not a skill score. Some models get large weights because they err low and cancel others that err high.
“When we apply the model weights to historical simulations, we completely eliminated the positive bias,” Fu said in the University of Cambridge release.
| Number | Value | Type |
|---|---|---|
| Mid-Holocene biomarker records | 46 cores, 54–83° N, 5,000–7,000 years old | Measured (compiled from published studies) |
| 2026 Arctic winter maximum | 14.29 million km², 15 March 2026 | Observed by satellite (NSIDC, preliminary) |
| Plain model average bias, March | Nearly 1 million km² too much ice | Calculated against observations |
| Weighted bias, March 1950–1999 | 0.016 million km² | Calculated against observations |
| Narrowing of the 95% range | About 6.3 million km² (85%) | Calculated, historical test |
| Weighted vs plain average, 2090–2099 | About 4–6% lower | Model projection, SSP1, SSP2, SSP5 |
| Northward ice-edge shift | Up to 5.5° of latitude (about 600 km) | Model projection; km by SciQuest |
Sources: Fu et al., Nature Geoscience (2026); NSIDC, 26 March 2026. 1° of latitude is about 111 km.
Why it matters to you
Nothing changes for you this winter. The lens here is “my world”: winter ice governs how much heat and moisture the Arctic Ocean gives off, and the paper notes industry interest in a longer shipping season. Less winter ice also matters for Arctic wildlife such as polar bears, which build up their fat while hunting seals from the sea ice, and for the people who live there.
Links to weather farther south are less certain. Using relationships found inside the models, the authors estimate that late winter and early spring snowfall over southeastern Greenland under SSP5 (2070–2099) may be underestimated by more than 30%, and that end-of-century winter–spring precipitation in the Mediterranean under the same scenario may be about twice what the plain model average expects. The paper itself says more research is needed to verify these links, so treat them as hypotheses.
What the evidence does not show
It does not show that winter ice will fall by a set amount by a set date. The future values come from the same models, re-weighted, and they inherit those models’ limits. If the real Arctic responds in a way no model captures, no weighting can fix it, a point the authors make themselves.
The central assumption is that models which matched the past will stay the better guides. The mid-Holocene was warmed by extra summer sunlight from Earth’s orbit, while today’s warming comes from greenhouse gases. The authors cite earlier modelling work finding that both warmings work through similar processes from autumn to winter, and they ran a leave-one-out test, which treats each model in turn as the “truth” to check whether the weighting can predict its future. Fu’s own summary in the release is blunt: “It doesn’t matter if the warming is natural variation or caused by human activity: if it warms, sea ice is going to melt.” That is a reasonable physical argument, but it remains an assumption, not a measurement.
Smaller caveats: the proxy is most sensitive near the winter ice edge, and sites such as the Laptev Sea add little because every model simulates heavy ice there. The 85% figure comes from the historical test, not from a check of the future.
How this fits what we already knew
Summer ice loss and the timing of a first ice-free September get most of the attention. Winter is different: winter extent varies least from year to year in observations, yet the models spread most widely in winter, and disagree most in March. Earlier efforts picked or weighted models using the short observational record. This study adds an out-of-sample test, a period the models were never tuned to, and finds that the mid-Holocene appears to constrain the models more strongly than the historical record alone. For another example of reading past climate from sediments, see how fossil pollen tied plant turnovers to ancient warmth.
Independent perspective
SciQuest found no published comment from a sea ice scientist outside the team as of 08:30 UTC on 18 October 2026, and has not yet interviewed one. The journal lists Chris Brierley and François Massonnet, with other anonymous reviewers, as the paper’s peer reviewers; neither has commented publicly that we could find. The paper’s own checks include nine sensitivity tests and the leave-one-out analysis.
How other headlines framed it
Fewer than two outlets have reported this independently, so there is no real range of framings to compare yet. What exists is the University of Cambridge release and its republications. Two framing choices are worth flagging:
- The University of Cambridge headline says winter ice loss “may be underestimated”, which matches the paper. Its first sentence is firmer, saying ice is “likely” to shrink by around one million km² more; the paper’s abstract says “may”.
- ECO Magazine retitled the release to say the loss far exceeds model estimates. The paper’s figure, about 4–6% lower ice by 2090–2099, is a meaningful shift but not a large multiple.
The release also says the method cut uncertainty in the projections by as much as 85%. In the paper, the 85% is measured in the historical test.
What happens next
Because the proxy data and code are public, other groups can rerun the weighting, add new cores or try it on the next generation of models. More cores from near the modern ice edge, where models disagree most, would sharpen the weights. The next real-world check on winter ice comes with NSIDC’s report on the March 2027 maximum. For a look at the ice at the other pole, read what lies underneath the ice in Antarctica.
In one sentence
Scoring climate models against 6,000-year-old seabed traces of sea ice suggests the Arctic will hold nearly 1 million km² less winter ice than the plain model average projects, a re-weighted projection that still needs other teams and future observations to confirm it.
Quick check: did it click?
- What did the team measure in the sediment cores? The sea ice algae biomarker IP25, compared with open-water sterols, in 46 records dated 5,000 to 7,000 years old.
- Is the “nearly 1 million km² less ice” an observation? No. It is a weighted average of model projections; the observation-based check covers 1950–1999.
- Why can’t we be sure the weights work for 2100? Because they were tested only on past climates, and the mid-Holocene warmed for a different reason than today.
Read next
- How big is a polar bear? The Arctic’s top predator and its seasonal dependence on sea ice.
- Are beluga whales endangered? Another Arctic species exposed to climate change.
- Fossil pollen and extreme ancient warmth, a different way of reading past climate.
Sources and disclosure
- Fu CY, Osman MB, Aquino-López MA. “Palaeoclimate constraints narrow uncertainty in future Arctic winter sea ice projections.” Nature Geoscience, published 16 October 2026 (received 9 December 2025, accepted 17 September 2026). doi:10.1038/s41561-026-02123-w
- Fu CY, Osman MB, Aquino-López MA. Bayes-paleo-weighting data and code. GitHub; Zenodo, doi:10.5281/zenodo.22305480.
- Fu CY, Osman MB, Aquino-López MA. “Bayesian calibration for the Arctic sea ice biomarker IP25.” Paleoceanography and Paleoclimatology 40, e2024PA005048 (2025). doi:10.1029/2024PA005048
- University of Cambridge. “Winter sea ice loss may be underestimated, according to ancient clues from a warmer Arctic.” 16 October 2026.
- National Snow and Ice Data Center. “Arctic sea ice record low maximum strikes again.” 26 March 2026.
- Coverage read for framing: ECO Magazine, Eurasia Review, Mirage News, Phys.org.
Disclosure: This article was drafted with AI assistance and checked against the sources above, including the full open-access paper. The authors declare no competing interests; the Cambridge release says the work was supported in part by the US National Science Foundation and the Cambridge Trust. Calculations by SciQuest: an 85% cut equal to 6.3 million km² implies a starting range of about 7.4 million km² and a remaining range of about 1.1 million km²; 1 million km² is about 7% of 14.29 million km²; 5.5° of latitude at about 111 km per degree is about 610 km, rounded to 600 km. The graphic is a SciQuest original built from values in the paper. Spotted an error? See our corrections policy.
Discover more from SciQuest
Subscribe to get the latest posts sent to your email.
Leave a comment