

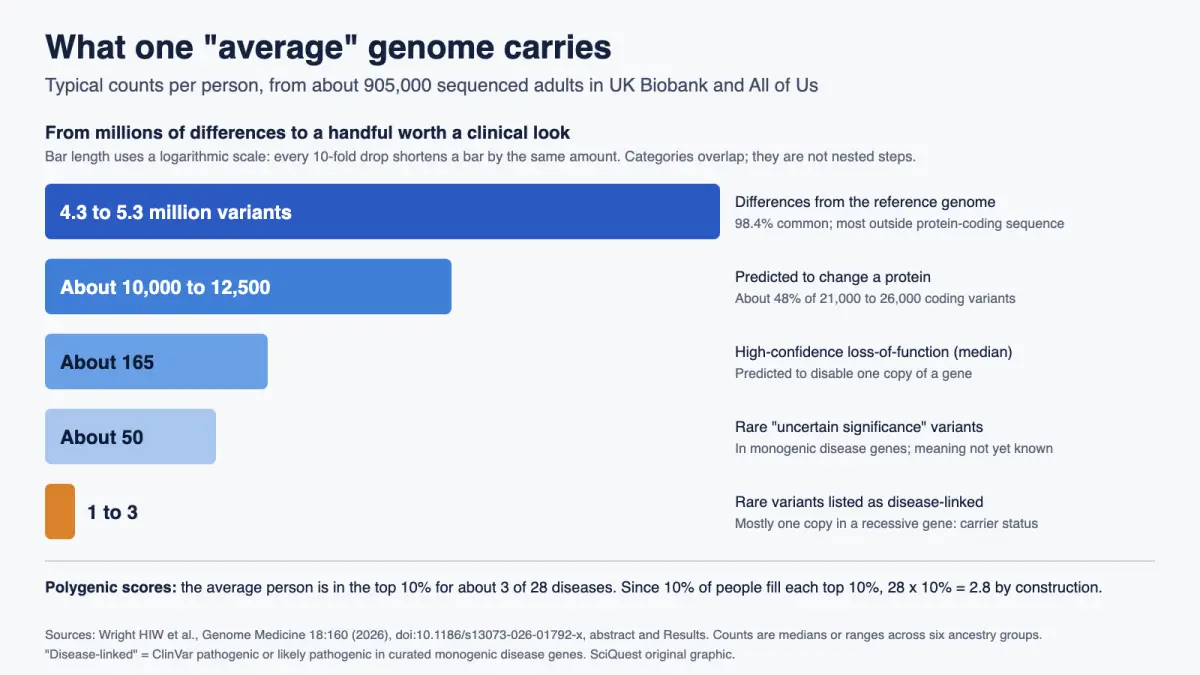
Across about 905,000 sequenced adults in UK Biobank and All of Us, a typical genome differs from the reference at 4.3 to 5.3 million sites, and only 1 to 3 of those are rare variants that ClinVar rates pathogenic or likely pathogenic in curated single-gene disease genes, mostly as one copy of a recessive gene.
Peer reviewed · Population biobank analysis · No health outcomes assessed
A University of Exeter team has described what an “average” human genome contains, using whole-genome data from about 905,000 adults in UK Biobank and the US All of Us program, published in Genome Medicine on 22 October 2026. A typical person differs from the reference genome at about 5 million places, carries 1 to 3 rare variants already listed as disease-linked, and lands in the top 10% of genetic risk scores for about 3 of 28 common diseases. The point is context: these findings are normal, and most do not mean disease. Both cohorts are mostly of European ancestry.
What you need to know
- Finding: A typical genome has about 4.3 to 5.3 million variants, about 10,000 to 12,500 predicted to change a protein, and 1 to 3 rare variants that ClinVar rates pathogenic or likely pathogenic in single-gene disease genes.
- Method: Per-person variant counts in 490,541 UK Biobank and 414,830 All of Us genomes, compared across six genetically inferred ancestry groups.
- Source: Wright, Beaumont and 14 co-authors, Genome Medicine 18, article 160 (2026), open access.
- Why it matters: As sequencing moves into screening, it gives a baseline for what a healthy genome contains, so a “pathogenic” result can be read in context.
- Limitation: About three-quarters of participants were grouped as European-like, and the team did not check participants’ health, so “linked to disease” is not the same as “causes disease in this person”.
Evidence at a glance
| Item | Assessment |
|---|---|
| Evidence status | Peer reviewed; descriptive analysis of two population biobanks. Not a clinical study; no health outcomes were assessed. |
| Primary source | Wright HIW et al. “The average individual genome: a survey of nearly 1 million whole-genome sequences”, Genome Medicine 18:160, published online 22 October 2026, doi:10.1186/s13073-026-01792-x, CC BY 4.0. |
| Evidence strength | Strong for the variant counts, because the sample is huge and two independent cohorts agreed. Moderate for the disease-related counts, which depend on ClinVar (accessed 8 December 2025) and on risk scores that work less well outside European-ancestry groups. |
| Principal limitation | Participants come only from the UK and USA, mostly of European ancestry, and were volunteers who tend to be healthier than average. Counts of disease-linked variants say nothing about whether any person became ill. |
| Coverage at a glance | 1 source found as of 22 October 2026, 15:12 UTC: the University of Exeter release on EurekAlert. No independent news reports were found in two web searches; reposts of the release would not be counted. |
Sources: the paper (abstract, Methods, Results and Discussion) and the University of Exeter release.
Is this a big deal?
It is a useful reference rather than a discovery. Most of the numbers were roughly known from smaller studies; what is new is gathering them per person, at this scale, in one paper.
What scientists found
The human reference genome has about 3.1 billion letters (base pairs). Against it, a typical person differs at 4.3 to 5.3 million sites, so roughly one site in every 600 to 700. A median of 98.4% of those variants are common, with an allele frequency above 1% in the same ancestry group. About 1.5% are rare, which still works out to some 65,000 to 80,000 rare variants per person.
Of the 21,000 to 26,000 small variants in protein-coding sequence, about 48% are predicted to change the protein. The median genome has 165 high-confidence loss-of-function variants, predicted to disable one copy of a gene.
Then the disease-related part. Limited to 4,262 curated single-gene (monogenic) disease genes, the average person carries about 1 to 3 rare variants rated pathogenic or likely pathogenic in ClinVar, a public database of variant classifications. Most are one copy of a gene for a recessive disease, which makes the person a carrier. Each person also has about 50 rare variants of uncertain significance in those genes, whose meaning is not yet known.
How they found it
UK Biobank recruited people aged 37 to 73; All of Us recruited adults from 18 to over 90. Both used the same model of Illumina sequencer, mostly on DNA from blood. The team filtered for quality, counted variants person by person, and used 28 disease risk scores already calculated in UK Biobank. In 2,334 parent-child trios they also counted new mutations absent from both parents: a mean of 61 per person, about 1.17 more for each year of the father’s age.
Why it matters to you
If you have had or are offered a genome test, this study suggests that a variant labelled “pathogenic” or “uncertain” is common, even in healthy adults. It cannot tell you what a single result means for you; that needs a genetics professional who weighs symptoms and family history. In the University of Exeter release, senior author Caroline Wright said: “Actually, variation is the norm.” See also whether identical twins have the same DNA.
What the evidence does not show
A ClinVar “pathogenic” label means a variant has been linked to disease, not that it causes disease in everyone who carries it. Many variants have incomplete penetrance, meaning some carriers never develop the condition. The paper’s example: truncating variants in the filaggrin gene, linked to eczema with incomplete penetrance, turn up in about 1 in 15 European-like participants. The authors write that most disease-associated variants they found “do not cause disease in that individual”. They also note that biobank volunteers tend to be healthier than the general population, so some true loss-of-function variants may simply be silent in them.
The polygenic finding needs a careful read. A polygenic score adds many small genetic effects into one risk ranking. By definition 10% of people sit in each score’s top 10%, so across 28 scores the average count must be 2.8. The paper’s “about 3” is that arithmetic, not evidence that most people face high risk of three diseases. In European-like UK Biobank participants, 102,831 of 450,209 (22.8%) were in the top 1% for at least one score, close to what chance alone predicts.
Show the maths: why “about 3 of 28” is expected
Each score ranks everyone, so exactly 10% of people fall in its top 10%. Averaged over people, each score contributes 0.1, and 28 scores give 28 x 0.1 = 2.8, whatever the diseases are.
For the top 1%: if the 28 scores were independent, the chance of missing the top 1% on all of them is 0.9928 = 0.755, so about 24.5% of people would land in at least one top 1%. The observed 22.8% is close to that, which the paper reports as matching expectation. The paper adds that with 100 scores, about 63% of people would be in at least one top 1%.
Ancestry is the other limit. In the authors’ groupings, 91.5% of UK Biobank and 56.5% of All of Us participants were European-like, about 75% combined. African-like genomes showed about a million more variants, partly because the reference genome comes mostly from European-like people. Non-European participants had more uncertain variants, and higher polygenic scores that the authors call “likely to be artefactual”. Short reads also miss many large structural variants.
How this fits what we already knew
The counts agree with earlier, smaller surveys. The paper calls its loss-of-function count consistent with the 149 to 182 per person reported by the 1000 Genomes Project, and its overall variant numbers match “numerous previous studies”. What changed is scale and the per-person view. SciQuest has also covered large genetic studies of personality and of OCD and tic disorders.
Independent perspective
SciQuest found no independent geneticist’s comment as of 22 October 2026, 15:12 UTC, and has not interviewed one. A clinical geneticist’s review of this article is pending.
How other headlines framed it
Only the University of Exeter release was found. It says each person has one to three rare variants “that have previously been shown to cause serious genetic diseases”. The paper is more cautious: it rates them pathogenic or likely pathogenic in ClinVar, notes that most make the person a carrier, and never calls them “serious”.
What happens next
The authors call for more diverse cohorts, long-read sequencing and complete reference genomes, and urge caution before screening programmes report many findings at once, citing overdiagnosis.
In one sentence
A typical healthy genome holds millions of differences and a few disease-linked variants, so one genetic “hit” means little without clinical context.
Quick check: did it click?
- About how many variants does a typical genome have compared with the reference? About 4.3 to 5.3 million, nearly all of them common.
- Why doesn’t a ClinVar “pathogenic” variant mean you will get the disease? Most are one copy of a recessive gene (carrier status), and many have incomplete penetrance.
Read next
- Can identical twins have the same DNA?
- What shapes personality?
- Scientists identify 36 risk genes linked to OCD and tic disorders
Sources and disclosure
- Wright HIW, Beaumont RN, Fasham J, Leslie JS, Chundru VK, Hall TS, Cannon SJ, Pagnamenta AT, Baple EL, Wood AR, Murray A, Jackson L, Weedon MN, Patel K, Hawkes G, Wright CF. “The average individual genome: a survey of nearly 1 million whole-genome sequences.” Genome Medicine 18:160, published 22 October 2026. doi:10.1186/s13073-026-01792-x (full text read on the publisher’s site).
- University of Exeter. “‘Average’ human genome described for first time, with implications for disease risk”, EurekAlert, 22 October 2026.
Disclosure: This article was drafted with AI assistance and checked against the sources above. It reports a health-related study and gives no medical advice. The authors declare no competing interests; funding came from the Medical Research Council, Wellcome and the NIHR Exeter Biomedical Research Centre. Calculations by SciQuest: 3.1 billion divided by 4.3 to 5.3 million is about 590 to 720; 1.5% of 4.3 to 5.3 million is about 65,000 to 80,000; 48% of 21,000 to 26,000 is about 10,000 to 12,500; 28 x 10% = 2.8; 1 – 0.9928 = 0.245; 102,831 / 450,209 = 22.8%; European-like share combined, (448,608 + 234,353) / 905,371 = 75%. The graphic is a SciQuest original built from the paper’s reported values. Spotted an error? See our corrections policy.
Discover more from SciQuest
Subscribe to get the latest posts sent to your email.
Leave a comment