

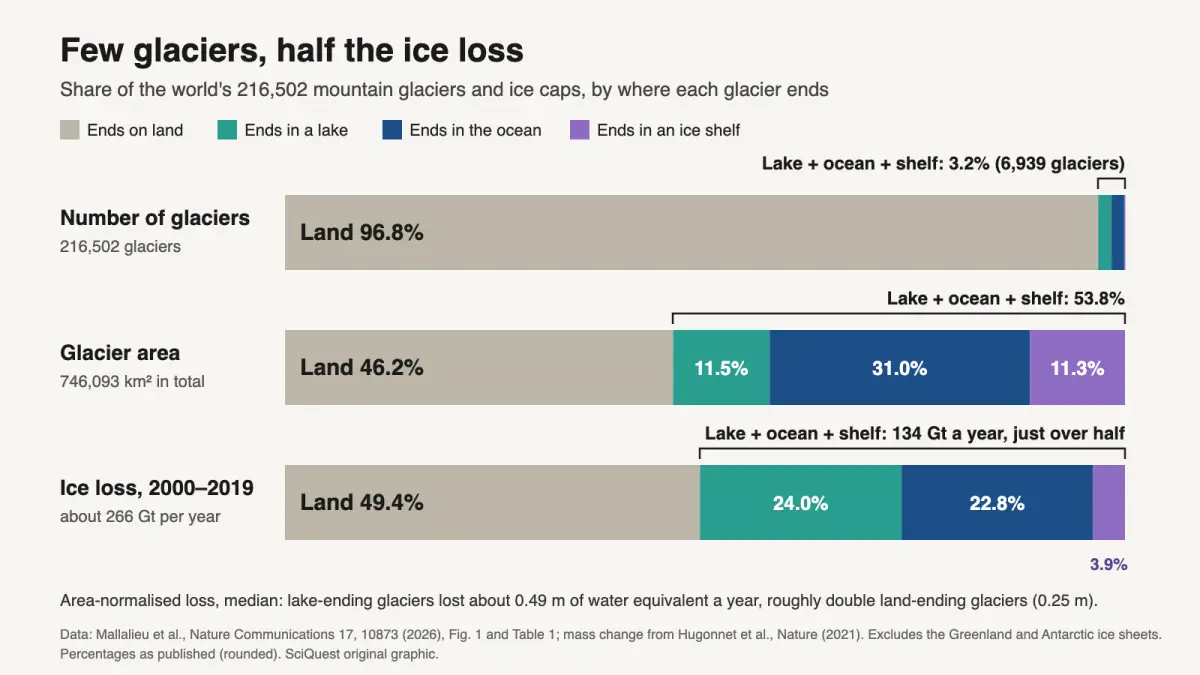
Glaciers that end in lakes, oceans or ice shelves are 3.2% of the world’s 216,502 mountain glaciers and ice caps, yet they lost about 134 gigatonnes of ice a year from 2000 to 2019, just over half of all glacier loss.
Peer reviewed · Global analysis of satellite-derived datasets · Association, not proven cause
A small group of glaciers carries a large share of the world’s glacier ice loss. Joseph Mallalieu, Nicholas Barrand and colleagues at the universities of Birmingham and Leeds, ETH Zurich and Manchester Metropolitan University sorted every glacier outside the Greenland and Antarctic ice sheets by where it ends. They report in Nature Communications that the 3.2% ending in water or ice shelves accounted for just over half of the loss in 2000 to 2019. Many models of future glacier change treat these glaciers too simply. The open question is why lake-ending glaciers lose ice fastest for their size.
What you need to know
- Finding: Lake-, ocean- and shelf-ending glaciers are 6,939 of 216,502 glaciers (3.2%) but cover 53.8% of glacier area and lost about 134 of roughly 266 Gt of ice a year in 2000 to 2019.
- Method: The team built a globally complete map of lake-ending glaciers from satellite lake inventories, then joined it to published data on glacier shape, flow speed, mass change and climate.
- Source: Mallalieu, Carrivick, Huss, Barr, Barrand and Raby, Nature Communications 17: 10873, published 23 October 2026 (open access).
- Why it matters: Glacier lakes are spreading as the climate warms, and the study suggests that land glaciers turning into lake glaciers could lose ice faster.
- Limitation: The links between terminus type, flow speed and ice loss are statistical associations; the authors cannot yet separate the effect of the lake from the effect of glacier size and shape.
Evidence at a glance
| Item | Assessment |
|---|---|
| Evidence status | Peer reviewed; observational analysis of global satellite-derived datasets (no new field measurements). |
| Primary source | “Global-scale variability of glacier velocity and mass loss across terminus environments”, Nature Communications 17: 10873, published 23 October 2026, CC BY 4.0. Data and code are public on Zenodo. |
| Evidence strength | Strong for the shares of count, area and ice loss, because they come from a complete classification applied to established global datasets. Moderate for the speed and loss differences, because they rest on statistical models that show association, with the cause unresolved. |
| Principal limitation | Bigger, faster glaciers may simply be more likely to reach a lake or the sea, so terminus type could partly reflect a glacier’s behaviour rather than drive it. |
| Coverage at a glance | 0 distinct credible publishers with their own reporting found as of 23 October 2026, 12:25 UTC. Counted: outlets that report beyond the press release. Not counted: the University of Birmingham release on EurekAlert and its repost on Phys.org. |
Sources: the paper (full text, Figure 1 and Table 1 read on nature.com), the University of Birmingham release, and a SciQuest web search on publication day.
Is this a big deal?
A solid step for glacier science rather than a new alarm. The total ice loss comes from an earlier global survey. What is new is a complete map of which glaciers end in lakes, showing that this small group carries half the loss.
What scientists found
Of the 216,502 glaciers in the Randolph Glacier Inventory, a standard global catalogue, 96.8% end on land. Lake-ending glaciers make up 1.6%, ocean-ending 1.5% and shelf-ending 0.1%. The inventory leaves out the two ice sheets but includes the smaller glaciers and ice caps around Greenland and Antarctica.
The water-ending glaciers are big. The median lake-ending glacier covers 2.00 km², about eight times the 0.24 km² of the median land-ending one. Together they drain 53.8% of all glacier area and produced about 134 Gt a year of the roughly 266 Gt lost. One gigatonne of ice holds as much water as a cubic kilometre, so 134 Gt is about 54 million Olympic swimming pools of water a year.
Lake-ending glaciers stood out most. Their median loss was 0.49 m of water equivalent a year, like a 49 cm layer of water stripped from their whole surface. That is roughly double the 0.24 to 0.25 m of land- and ocean-ending glaciers.
How they found it
The hard part was finding the lake-ending glaciers. The standard inventory flagged them in only 3 of its 19 regions. So the team used a global satellite inventory of glacier lakes, built from 254,795 Landsat scenes, and counted a glacier as lake-ending if a lake touched its front at any point from 2000 to 2018.
They then joined that map to flow speeds for 2017 to 2018 and mass change for 2000 to 2019, both from earlier global satellite studies. Statistical models controlled for climate, ice thickness, slope, elevation and other factors. After those controls, lake-ending glaciers flowed about 10% faster than land-ending ones and ocean-ending glaciers about 44% faster. Lake-ending glaciers also lost about 57% more ice for their size than land-ending ones.
Think of a glacier as a slow conveyor belt: snow is added high up and ice is carried down to the end. When the belt ends in water, icebergs break off (calving) and the water melts ice below the waterline, so the end is removed faster. The comparison has a limit. Glaciers also thin across their whole surface, and the paper’s numbers cover the whole glacier, not only the front.
Mallalieu put it plainly in the University of Birmingham release: “Glaciers ending in lakes really stand out: they’re losing ice particularly quickly. We don’t yet know exactly why.”
Why it matters to you
Glacier melt feeds rivers people drink from, raises sea level and can cause floods downstream. The authors say their inventory should improve projections of all three. It won’t change anything in your week, but they warn that the spread of glacier lakes could push global glacier loss higher.
What the evidence does not show
It does not show that lakes cause the extra loss. Lakes may speed it through calving, underwater melt and water reaching the glacier bed. Or the glaciers’ size and gentle lower slopes may explain it, since such glaciers respond slowly to warming. Both may play a part.
Any glacier touching a terminus lake counts as lake-ending, however small the contact, which the authors say probably makes their differences conservative. The study covers mountain glaciers and ice caps, not the ice sheets, and describes 2000 to 2019 without projecting the future.
How this fits what we already knew
Regional work in the Himalaya, Greenland and New Zealand had already found faster flow or faster thinning at lake-ending glaciers. This paper tests the pattern worldwide and finds it holds: lake-ending glaciers lost more per square metre than land- or ocean-ending ones in 15 of the 18 regions with data. The ice sheets are a separate story; see SciQuest’s earlier piece on Antarctica’s Thwaites Glacier and on what lies beneath the Antarctic ice.
Independent perspective
SciQuest found no comment from a glaciologist outside the author team as of 23 October 2026, 12:25 UTC, and has not yet interviewed one.
How other headlines framed it
- The University of Birmingham release on EurekAlert led with the 3% and half-of-loss figures and said lake-ending glaciers were “losing ice 57% faster”. Its body adds “relative to their size”, which is the paper’s meaning: 57% more loss per square metre, not faster flow.
- Phys.org carried the same release under the same headline; SciQuest could not open the page (bot check). No independent outlet had reported the study when SciQuest checked.
What happens next
The authors call for closer monitoring of water-ending glaciers and better handling of them in models. Their next question is how a lake’s area, depth and temperature change a glacier’s behaviour. The inventory and code are public for other teams to test.
In one sentence
A tiny fraction of the world’s glaciers, those ending in lakes or the sea, accounted for half of glacier ice loss in 2000 to 2019, and lake-ending glaciers lost the most for their size for reasons scientists are still working out.
Quick check: did it click?
- What share of glaciers end in lakes, oceans or ice shelves? 3.2%, or 6,939 of 216,502.
- Does “57% more” mean lake glaciers flow 57% faster? No. It is ice loss per square metre; their flow was about 10% faster than land glaciers after controls.
- Does the study include the Greenland and Antarctic ice sheets? No, only the glaciers and ice caps outside them.
Read next
- Thwaites Glacier and rising seas: the ice-sheet side of the story, which this study leaves out.
- What percent of Earth is water?
- What is underneath the ice in Antarctica? Hundreds of lakes sit below it.
Sources and disclosure
- Mallalieu J, Carrivick JL, Huss M, Barr ID, Barrand NE, Raby CL. “Global-scale variability of glacier velocity and mass loss across terminus environments.” Nature Communications 17: 10873, published 23 October 2026. doi:10.1038/s41467-026-78654-y (full text, Figure 1 and Table 1 read).
- Mallalieu J et al. Glacier and climate database with terminus inventory. Zenodo, doi:10.5281/zenodo.22712528.
- Hugonnet R et al. “Accelerated global glacier mass loss in the early twenty-first century.” Nature 592: 726–731 (2021), the source of the 2000 to 2019 mass change used in the paper.
- University of Birmingham news release, “Just 3% of the world’s glaciers account for over half of glacier ice loss”, EurekAlert, October 2026.
Disclosure: This article was drafted with AI assistance and checked against the sources above, including the full open-access paper. The authors declare no competing interests; the work was funded in part by the Leverhulme Trust and UKRI. Calculations by SciQuest: 134 Gt is the sum of the paper’s lake (63.8), ocean (60.4) and shelf (10.2) values, out of a 265.6 Gt total; 1 Gt of ice is about 1 km³ of water, and at 2,500 m³ per Olympic pool, 134 km³ is about 54 million pools. The graphic is a SciQuest original built from the paper’s published values. Spotted an error? See our corrections policy.
Discover more from SciQuest
Subscribe to get the latest posts sent to your email.
Leave a comment