

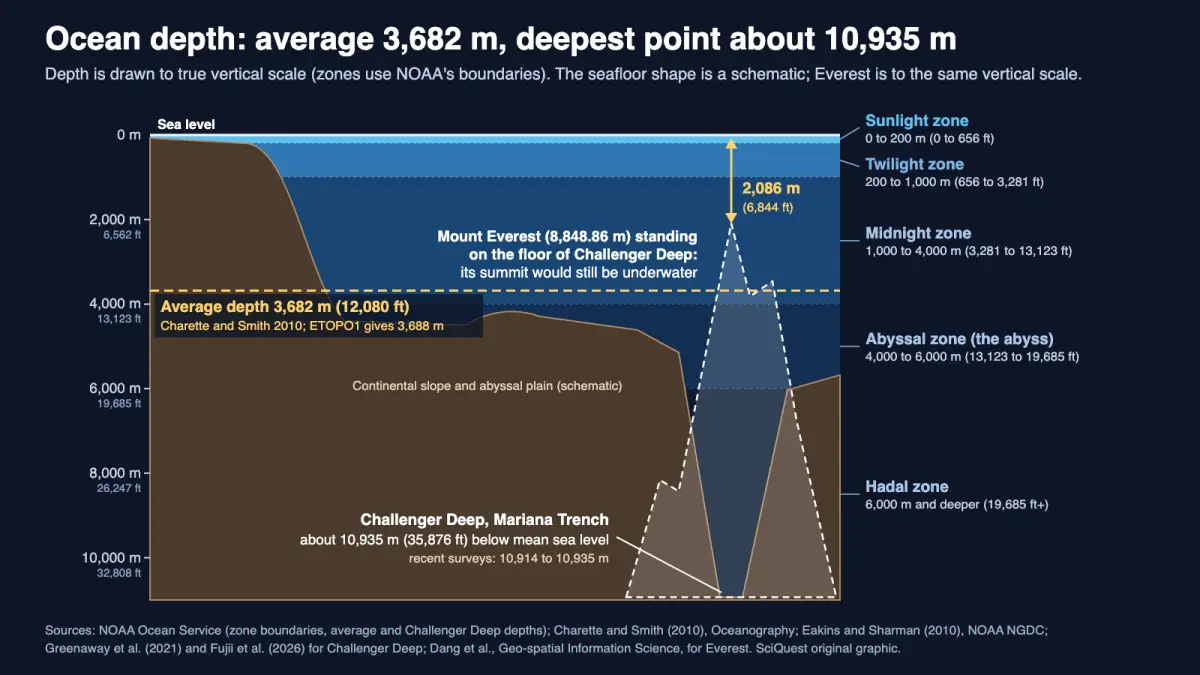
Satellite-based bathymetry puts the average ocean depth at 3,682 m, about a third of the 10,935 m measured at the Challenger Deep, but ships have mapped only 28.7% of the seafloor to modern standards, so even the average is still an estimate.
The ocean is about 3,682 metres (12,080 feet, or roughly 2.3 miles) deep on average, and about 10,935 m (35,876 ft, or 6.8 miles) at its deepest point, the Challenger Deep in the Mariana Trench in the western Pacific. The average comes from a 2010 calculation by Matthew Charette of Woods Hole Oceanographic Institution and Walter Smith of NOAA, and NOAA still uses it. The deepest figure comes from submersible dives in June 2020, with a stated uncertainty of ±6 m.
Neither number is final. The average rests mostly on satellite estimates, because most of the seafloor has not yet been mapped to modern standards. Recent surveys of the Challenger Deep disagree with each other by up to about 20 m, and an older one by about 50 m.
Explain it like I’m busy:
- Average depth: 3,682 m (12,080 ft, 3.7 km, 2.3 mi). A separate NOAA calculation gives 3,688 m.
- Deepest point: Challenger Deep, about 10,935 m (35,876 ft, 6.8 mi), close to three times the average.
- Stand Mount Everest (8,848.86 m) on the floor of the Challenger Deep and its summit would still be about 2,086 m (6,844 ft) underwater.
Key facts about ocean depth
- Average: 3,682.22 m, with a one-standard-deviation uncertainty of 1.2%, or about ±44 m (Charette and Smith, 2010).
- Deepest: 10,935 m ±6 m at 95% confidence, from pressure measured on submersible dives (Greenaway and colleagues, 2021). Ship sonar surveys since 2019 give 10,914 to 10,932 m.
- By ocean: the Pacific averages 4,080 m and the Arctic 1,205 m in NOAA’s ETOPO1 calculation (Eakins and Sharman, 2010).
- Mapping: 28.7% of the ocean floor had been mapped to modern standards by April 2026, according to the Seabed 2030 project.
- Zones: by NOAA’s boundaries, the average seafloor lies in the midnight zone (1,000 to 4,000 m), and only depths below 6,000 m count as the hadal zone.
How deep each ocean is: average and maximum depth
Depth varies a lot between basins. The table uses one consistent source, NOAA’s ETOPO1 calculation, so every row was measured the same way and with the same ocean boundaries.
| Ocean | Surface area (million km²) | Average depth (m) | Average depth (ft) | Maximum depth in the grid (m) | Maximum depth in the grid (ft) |
|---|---|---|---|---|---|
| Pacific | 161.76 | 4,080 | 13,386 | 10,803 | 35,443 |
| Indian | 70.56 | 3,741 | 12,274 | 7,906 | 25,938 |
| Atlantic | 85.13 | 3,646 | 11,962 | 8,486 | 27,841 |
| Southern (south of 60° S) | 21.96 | 3,270 | 10,728 | 7,075 | 23,212 |
| Arctic | 15.56 | 1,205 | 3,953 | 5,567 | 18,264 |
| All oceans | 361.9 | 3,688 | 12,100 | 10,803 | 35,443 |
Source: Eakins and Sharman (2010), Volumes of the World’s Oceans from ETOPO1, NOAA National Geophysical Data Center. Boundaries are adapted from the International Hydrographic Organization’s 1953 limits. The grid averages depth over cells of roughly 4 km², so its maximum (10,803 m) is shallower than spot measurements; the same page gives 10,911 m as the measured Mariana Trench maximum. Feet are SciQuest conversions (1 ft = 0.3048 m), rounded to the nearest foot.
The Pacific is the deepest ocean on average as well as at its lowest point, and the Arctic averages just 1,205 m. The all-ocean average here, 3,688 m, is 6 m deeper than Charette and Smith’s 3,682 m because it uses a different elevation grid.
The deepest spot in each ocean is a separate question, answered best by ship sonar rather than a global grid. The Five Deeps Expedition surveyed all five in 2018 and 2019 with the same full-ocean-depth echosounder.
| Ocean | Deepest point | Depth (m) | Depth (ft) |
|---|---|---|---|
| Pacific | Challenger Deep, Mariana Trench | 10,924 ± 15 | 35,840 |
| Atlantic | Brownson Deep, Puerto Rico Trench | 8,378 ± 5 | 27,487 |
| Southern | Unnamed deep, South Sandwich Trench | 7,432 ± 13 | 24,383 |
| Indian | Unnamed deep, Java Trench | 7,187 ± 13 | 23,579 |
| Arctic | Molloy Hole, Fram Strait | 5,551 ± 14 | 18,212 |
Source: Bongiovanni, Stewart and Jamieson (2021), Geoscience Data Journal 9, 108 to 123. Depths were corrected with full-depth CTD (conductivity, temperature and depth) profiles. Feet are SciQuest conversions of the central value.
What 3,682 metres means in everyday terms
The clearest way to picture the deep ocean is to put the tallest mountain in it. Mount Everest’s official height is 8,848.86 m, measured to the snow surface in the 2019 to 2020 China and Nepal survey. Set it on the bottom of the Challenger Deep and the summit still sits about 2.1 km below the waves.
The comparison has a limit: Everest’s height and the trench’s depth are both measured from (approximately) sea level, but neither describes a real mountain standing in a real trench. It only compares two vertical distances on the same scale, as the diagram below does.
Another way to feel the distance is by time. At an easy walking pace of 5 km/h, a straight-down walk to the average seafloor would take about 44 minutes. Reaching the Challenger Deep would take about 2 hours 11 minutes. Those times are our arithmetic with an assumed pace, not a measurement.
The pressure is what makes these depths hostile. NOAA’s rule of thumb is one extra atmosphere for every 10.06 m of seawater. On that rule, the average seafloor is at roughly 370 times surface air pressure and the Challenger Deep at roughly 1,090 times. It is a rule of thumb, not an exact conversion.
The Everest and Challenger Deep comparison, worked to the metre
- Challenger Deep: 10,935 m below mean sea level (Greenaway et al., 2021).
- Mount Everest: 8,848.86 m above the height reference (Dang et al.).
- Water left above the summit: 10,935 − 8,848.86 = 2,086.14 m, or about 2,086 m. That is 6,844 ft, or 1.30 miles.
- With the shallowest recent survey value, 10,914 m, the gap is 2,065 m; with the 2014 value of 10,984 m, it is 2,135 m. Every modern figure gives about 2.1 km.
- Highest point to lowest point on Earth’s solid surface: 8,848.86 + 10,935 = 19,783.86 m, or about 19.8 km (64,908 ft).
- Deepest point compared with the average: 10,935 ÷ 3,682 = 2.97, so close to three times.
How scientists measure ocean depth
The first depth recorded at the Challenger Deep came from HMS Challenger in 1875, which used a sounding line and logged 8,184 m. That was more than 2.7 km short of the modern value.
Echosounders arrived in the 1920s. A ship sends a sound pulse down and times the echo, and the depth is the sound speed multiplied by half the travel time. Modern multibeam echosounders, such as the Kongsberg EM124 used by the Five Deeps Expedition and on R/V Hakuho-maru, map a strip of seafloor on each pass rather than a single point.
Ships can’t cover the whole ocean, so the global average leans on satellites. Satellite altimeters measure the height of the sea surface, and small bumps and dips in it reflect gravity anomalies caused by seafloor features, which can be converted to estimated depth. Charette and Smith used the SRTM30_PLUS grid, which combines that satellite method with quality-controlled ship soundings, and calculated a mean of 3,682 m and an ocean volume of 1.332 billion km³.
Their supporting tables show how much rests on estimation. Grid cells with real soundings covered 32.5 million km², about 9% of the ocean, and averaged 3,504 m. The satellite-estimated cells averaged 3,700 m. Ships mostly survey shallow coastal water, so the measured sample is not random.
The deepest value uses a different trick. Greenaway and colleagues combined a submersible’s pressure sensor with an acoustic altimeter that measured its height above the seafloor, then converted pressure to depth after correcting for water properties, atmospheric pressure, gravity anomalies and water level. Their deepest observed seafloor was 10,935 m below mean sea level, ±6 m.
Why sources give different ocean depths
A search turns up 3,682 m, 3,688 m, 3,700 m, 10,911 m, 10,935 m and “about 11,000 m”. Most of these are honest results from different methods, grids and dates.
The average depends on the map. Published averages have fallen from 3,814 m in 1921 to 3,682 m in 2010, as better surveys found more seamounts and ridges that earlier soundings missed. Charette and Smith calculated that if the unmapped areas turned out as shallow as the mapped ones, the ocean’s volume could change by about 7%. Their 1.2% depth uncertainty assumes the satellite estimates hold up.
Sound speed changes sonar depths. The speed of sound varies through the water column, so every sonar depth depends on an assumed sound-speed profile, usually built from instrument casts such as CTD profiles. Because depth equals speed times half the travel time, a 1% error in sound speed gives a 1% depth error, about 109 m at the Challenger Deep (our calculation). In a 2026 paper on a 2023 survey by R/V Hakuho-maru, Masakazu Fujii and colleagues tested five sound-speed models on the same data and got maximum depths from 10,914 to 10,932 m.
Tides and the sea-level reference matter. The sea surface rises and falls, so a depth needs a fixed reference. Greenaway’s team reported depth below mean sea level after correcting for water-level effects and atmospheric pressure, and found that the gravity correction was substantial.
Older surveys and grids differ. A 2010 multibeam survey reported 10,984 ± 25 m (Gardner and colleagues, 2014), 49 m deeper than the 2020 dives. A global grid such as ETOPO1 averages depth over each cell, which makes its maximum shallower, at 10,803 m. Rounded figures of 11,000 m or more still circulate online, and a 2019 review warned that out-of-date depths have “propagated uncorrected through online sources and the scientific literature”.
Our reading: quote the average as about 3,700 m (3,682 m to four figures), and the deepest point as about 10,900 m, or 10,935 m ±6 m for the best single measurement.
How deep the zones go
NOAA divides the water column by light. The sunlight zone covers the top 200 m (656 ft). The twilight zone runs from 200 to 1,000 m, and below 1,000 m lies the aphotic zone, which receives no sunlight.
That dark water is split three ways: the midnight zone from 1,000 to 4,000 m, the abyss from 4,000 to 6,000 m, and the hadal zone from 6,000 m down. The average depth of 3,682 m falls in the lower midnight zone, about 300 m above the abyss. Only the Pacific’s average, 4,080 m, reaches the abyss.
Why it matters to you
For most readers this is a wonder question, and the honest answer is that we know the deepest metre better than we know the average. A precise ocean volume matters to scientists because geochemical budgets and climate models depend on it, Charette and Smith write, though their revision was too small to change those budgets much.
The bigger gap is the map. NOAA Ocean Exploration notes that high-resolution ship mapping is needed to refine the satellite picture, and with 28.7% mapped, most of the seafloor is still known only in outline. Charette and Smith expect the average to change only as ships map more of the ocean, a process they called very slow in 2010.
“But wait…”
A fair objection is that satellites cannot see through 4 km of water. They don’t. They measure the height of the sea surface, which bulges slightly over seafloor mountains because of their extra gravity, and the bulges are converted to depth with help from ship soundings. That is why the satellite-only parts of the map are coarse, and why ships are still needed.
A second doubt is whether 3,682 m is a typical depth, given how much shallow coastline it includes. The three largest oceans, the Pacific, Indian and Atlantic, all average between 3,646 and 4,080 m in the ETOPO1 table, while the Arctic’s 1,205 m pulls the global figure down.
Related questions
How deep is the ocean in miles? About 2.3 miles on average (3,682 m) and about 6.8 miles at the Challenger Deep (10,935 m).
How deep is the ocean in feet? About 12,080 ft on average and about 35,876 ft at its deepest point.
How deep is the ocean floor? It depends on where you are. The global average floor is 3,682 m down, the Arctic averages 1,205 m and the Pacific 4,080 m, and the hadal zone begins at 6,000 m.
What lives at the deepest point? Our guide to what lives in the Mariana Trench covers the animals found there.
Why is the deep ocean dark? Sunlight is absorbed on the way down, and NOAA puts the start of the lightless aphotic zone at 1,000 m. For the colour of the water nearer the surface, see why water looks blue.
In one sentence
The ocean averages about 3,682 m (12,080 ft, 2.3 mi) deep and reaches about 10,935 m (35,876 ft, 6.8 mi) at the Challenger Deep, deep enough to cover Everest with 2 km of water to spare, but the average is still mostly a satellite estimate.
Quick check: did it click?
- What is the ocean’s average depth? About 3,682 m (12,080 ft), from Charette and Smith’s 2010 calculation; NOAA’s ETOPO1 gives 3,688 m.
- Why do sonar depths of the Challenger Deep differ by metres to tens of metres? Mostly the assumed speed of sound in the water column, plus corrections for sea level, method and the size of the sonar footprint.
- How far below the surface would Everest’s summit be if it stood in the Challenger Deep? About 2,086 m (6,844 ft).
Read next
Disclosure: This article was drafted with AI assistance and checked against the sources below. Unit conversions, the Everest comparison, walking times and pressure estimates are SciQuest calculations, and the depth diagram is an original SciQuest graphic. Spotted an error? See our corrections policy.
Sources
- NOAA Ocean Service, How deep is the ocean? (3,682 m average; Challenger Deep about 10,935 m; first sounded by HMS Challenger in 1875)
- NOAA Ocean Exploration, How deep is the ocean? (2010 satellite-based average; need for high-resolution mapping)
- M. A. Charette and W. H. F. Smith (2010), The Volume of Earth’s Ocean, Oceanography 23(2), 112 to 114 (3,682.22 m mean depth, 1.2% uncertainty, 1.332 billion km³, pinged and estimated means, historical estimates)
- B. W. Eakins and G. F. Sharman (2010), Volumes of the World’s Oceans from ETOPO1, NOAA National Geophysical Data Center (archived copy; the original NOAA address now redirects to the ETOPO product page)
- S. F. Greenaway, K. D. Sullivan, S. H. Umfress, A. B. Beittel and K. D. Wagner (2021), Revised depth of the Challenger Deep from submersible transects, Deep Sea Research Part I 178, 103644 (10,935 m ±6 m)
- M. Fujii, C. Tamura, Y. Ohara and K. Okino (2026), Full-ocean-depth EM124 mapping of the Challenger Deep by R/V Hakuho-maru and depth-estimate sensitivity tests, Scientific Data 13, 1304 (10,914 to 10,932 m across sound-speed models)
- C. Bongiovanni, H. A. Stewart and A. J. Jamieson (2021), High-resolution multibeam sonar bathymetry of the deepest place in each ocean, Geoscience Data Journal 9, 108 to 123
- H. A. Stewart and A. J. Jamieson (2019), The five deeps: The location and depth of the deepest place in each of the world’s oceans, Earth-Science Reviews 197, 102896
- J. V. Gardner, A. A. Armstrong, B. R. Calder and J. Beaudoin (2014), So, How Deep Is the Mariana Trench?, Marine Geodesy 37, 1 to 13 (10,984 ± 25 m; HMS Challenger’s 8,184 m sounding)
- Y. Dang et al., Determining the new height of Mount Qomolangma based on the International Height Reference System, Geo-spatial Information Science 27(4), 1182 to 1191 (8,848.86 m)
- NOAA Ocean Service, How far does light travel in the ocean? (zone boundaries)
- NOAA Ocean Service, How does pressure change with ocean depth? (one atmosphere per 10.06 m)
- International Hydrographic Organization, Global seabed mapping reaches new milestone, 28 April 2026 (28.7% of the ocean floor mapped)
Discover more from SciQuest
Subscribe to get the latest posts sent to your email.
Leave a comment