

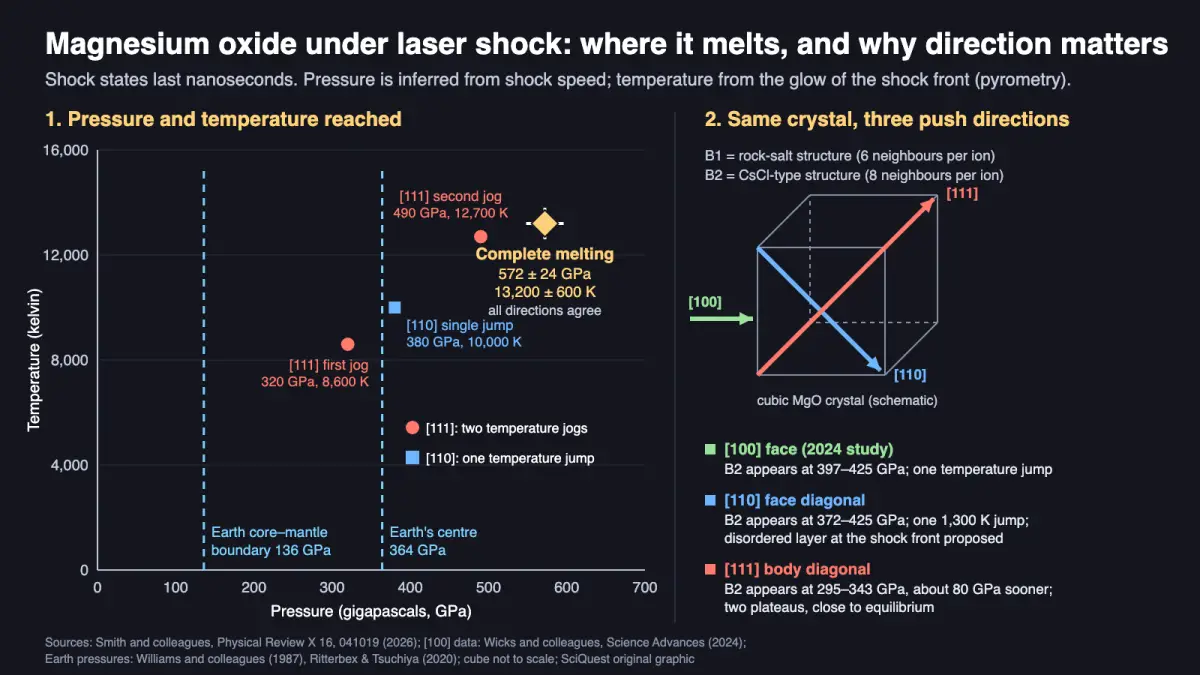
Laser shocks on magnesium oxide crystals put its complete melting at 572 ± 24 GPa and 13,200 ± 600 K, and squeezing along the cube’s long diagonal let it change structure about 80 GPa sooner than squeezing along other directions.
Peer reviewed · Laboratory shock experiments · One research group
Magnesium oxide, a common mineral inside rocky planets, behaves differently depending on which way its crystal is squeezed, a team led by Raymond Smith of Lawrence Livermore National Laboratory reports in Physical Review X. Using laser-driven shock waves, the LLNL and Johns Hopkins researchers found that all three directions end in full melting near 572 GPa and 13,200 K, which the authors call the highest melting temperature recorded for any known material at such pressures. The catch: these states last nanoseconds, and pressure and temperature are inferred, not read off a gauge.
What you need to know
- Finding: Squeezed along the [111] body diagonal, MgO switched to its denser B2 structure between 295 and 343 GPa; along the [110] face diagonal, not until 372 to 425 GPa. All directions melted completely at 572 ± 24 GPa and 13,200 ± 600 K.
- Method: 28 laser shots on single crystals at the Omega EP laser in Rochester, New York, recorded shock speed and the shock front’s glow (for temperature), plus nanosecond X-ray snapshots of the atoms in 21 shots.
- Source: Smith, Singh, Ye and six co-authors, Physical Review X 16, 041019, published 19 October 2026 (open access).
- Why it matters: Models of super-Earth mantles and giant-planet cores need to know where MgO is solid and where it is liquid, and earlier experiments disagreed with theory.
- Limitation: The melting point is inferred from where the three temperature records converge; liquid MgO could not be seen directly in the X-ray data.
Evidence at a glance
| Item | Assessment |
|---|---|
| Evidence status | Peer reviewed; laboratory laser-shock experiments on single crystals by one collaboration (LLNL, Johns Hopkins, SLAC). |
| Primary source | “Orientation-Dependent Structural Phase Transitions and Melting in Shock-Compressed MgO”, Phys. Rev. X 16, 041019, published 19 October 2026, CC BY 4.0. |
| Evidence strength | Moderate: temperature and X-ray data agree across 28 shots and match one equilibrium theory, but it is one group, and the melting point revises that group’s own 2024 estimate of 634 GPa. |
| Principal limitation | Reported “pressure” assumes the crystal was squeezed evenly. The authors note it was squeezed in one direction, and MgO’s strength at these pressures is unknown, so the true pressure could be somewhat lower. |
| Coverage at a glance | 0 distinct publishers with their own reporting as of 23 October 2026, 12:40 UTC. Not counted: LLNL’s release as reposted on Phys.org. |
Sources: the paper (full PDF read), Crossref, and a SciQuest web search.
Is this a big deal?
A solid step for mineral physics. It explains why earlier shock experiments on MgO clashed with theory and gives planet modellers a melting point measured above Earth’s central pressure. On its own, it won’t settle how super-Earths work.
What scientists found
At everyday pressure, MgO has the same atomic layout as table salt, called B1: each magnesium ion sits among 6 oxygen ions. Squeeze hard enough and it rearranges into B2, the layout of caesium chloride, where each ion has 8 neighbours. That denser structure is the one expected deep inside rocky planets larger than Earth.
How the crystal is pushed decides the route. Along the [111] direction, the line from one corner of the cube to the opposite corner, B2 first appeared between 295 and 343 GPa. Along the [110] face diagonal it waited until 372 to 425 GPa, roughly 80 GPa later. An earlier study by the same group found a similar delay for pushes square to a cube face, the [100] direction.
Think of a folding chair: press the way its hinges move and it folds at once; press from the side and it jams until something gives. The [111] push lines up with one atomic route to B2, the Buerger mechanism, while other pushes must take a slower route. Atoms have no hinges, so the chair only pictures the geometry.
How they found it
The work ran at the Omega EP laser, part of the University of Rochester’s Laboratory for Laser Energetics. A pulse lasting 1 or 10 nanoseconds drove a shock wave through a transparent MgO crystal. One instrument tracked the shock’s speed, from which pressure follows using earlier MgO data. Another recorded its glow, which gives temperature (pyrometry). In 7 shots the shock faded as it travelled, sweeping a range of pressures; in 21 more, a 2-nanosecond X-ray flash caught the atomic layout.
The temperature records differed by direction. Along [111], temperature stalled twice: once during the switch to B2 and once during melting, the pattern expected near equilibrium. Along [110], it showed a single jump of about 1,300 K. The authors propose that a thin, briefly disordered layer forms right at the shock front and then recrystallises behind it, an idea from computer simulations that they say had lacked experimental support.
“We started with a mystery. Why didn’t our measurements agree with the expected behavior of magnesium oxide?” Smith said in LLNL’s release.
Why it matters to you
Nothing changes in your day. This is about how planets work: whether deep rock is solid or molten shapes how a world moves heat. For where MgO sits in our own planet, see the layers of Earth.
What the evidence does not show
Melting is inferred. The X-ray signal from liquid MgO was too weak to detect, so complete melting rests on the three temperature curves converging, a temperature plateau ending, the shock front losing its shine and the last B2 signal at 611 GPa.
The record claim is narrower than some coverage suggests. The paper says that, to the authors’ knowledge, MgO has the highest recorded melting temperature of any known material “at these extreme pressures”, ahead of iron, tantalum and diamond. Parts of those other melting curves are extrapolated.
Timescale matters too. The direction effect belongs to very fast squeezing, while planets sit at these conditions for billions of years. So the [111] results, closest to equilibrium, matter most for planet models.
How this fits what we already knew
In 2024 the same team, pushing along [100], placed the B1 to B2 switch at 397 to 425 GPa and complete melting at 634 GPa. Those numbers fit theories that include extra atomic jiggling, called anharmonicity; one such calculation lets B1 survive to about 465 GPa. The new [111] data put the switch near 330 GPa instead, matching simpler calculations. The authors say this challenges current high-temperature models of MgO.
For scale, 572 GPa is about 1.6 times the 364 GPa at Earth’s centre and about 4.2 times the 136 GPa at the core–mantle boundary. In everyday terms it is about 5.6 million times sea-level air pressure, at roughly 12,900 °C. For other extreme temperatures, see the hottest things in the universe.
Independent perspective
SciQuest found no comment from a scientist outside the team as of 23 October 2026, 12:40 UTC, and has not yet interviewed one. June Wicks of Johns Hopkins, a co-author, summed up the aim in the release: “These experiments help us determine where it can remain solid and where it becomes liquid, which matters for how planets transport heat and evolve.”
How other headlines framed it
Only LLNL’s release, reposted by Phys.org, has covered it. It leads with the surprise that direction matters and states the melting record without the paper’s “at these extreme pressures” qualifier. It also says much of the deepest mantle is MgO crystals, while the paper calls MgO, mixed with iron oxide, the lower mantle’s second most abundant phase.
What happens next
The authors argue that some older melting curves, worked out by assuming a single temperature jump marks melting, could be too low. They name silica (SiO2) and the mantle mineral Mg2SiO4 as candidates to revisit. Extrapolating their curve, they suggest solid MgO may exist in the cores of Jupiter and Saturn, but liquid MgO in the hotter exoplanet CoRoT-9b.
In one sentence
Magnesium oxide melts near 13,200 K at about 572 GPa however it is squeezed, but the direction of a laser shock changes how and when its crystal rearranges on the way, which helps explain years of mismatched experiments.
Quick check: did it click?
- Which push direction let MgO switch to B2 soonest? Along [111], the cube’s corner-to-corner diagonal, at 295 to 343 GPa.
- How was the temperature measured? From the glow of the shock front (pyrometry), during shocks lasting nanoseconds.
- Is 13,200 K the highest melting point of anything, at any pressure? No. The authors compare materials at these extreme pressures, using partly extrapolated curves.
Read next
- From crust to core: the layers of Earth. The mantle and core, layer by layer.
- What exactly is an Earth-like planet? The rocky worlds, some far bigger than ours, whose insides this experiment helps model.
- What is the hottest thing in the universe? 13,200 K on the cosmic scale.
Sources and disclosure
- Smith, R. F., Singh, S., Ye, Z., Millot, M., Sims, M., Hari, A., Eggert, J. H., Coppari, F. and Wicks, J. K. “Orientation-Dependent Structural Phase Transitions and Melting in Shock-Compressed MgO.” Physical Review X 16, 041019, published 19 October 2026. doi:10.1103/vt45-32bb. Full journal PDF read.
- Lawrence Livermore National Laboratory. “A mineral from the inside of planets reveals a surprising lesson: How you push matters.” News release as published on Phys.org, 23 October 2026 (source of both quotes).
- Wicks, J. K. et al. “B1-B2 transition in shock-compressed MgO.” Science Advances 10, eadk0306 (2024). Open full text (PMC11160462).
- Williams, Q. et al. “The Melting Curve of Iron to 250 Gigapascals: A Constraint on the Temperature at Earth’s Center.” Science 236, 181 (1987). CaltechAUTHORS record (core–mantle boundary pressure, 136 GPa).
- Ritterbex, S. and Tsuchiya, T. “Viscosity of hcp iron at Earth’s inner core conditions from density functional theory.” Scientific Reports 10, 6311 (2020). doi:10.1038/s41598-020-63166-6 (inner core pressures 329 to 364 GPa).
Disclosure: This article was drafted with AI assistance and checked against the sources above. The study was funded by the US Department of Energy (including LLNL’s Laboratory Directed Research and Development program) and the Defense Threat Reduction Agency; the authors declare no competing interests. Calculations by SciQuest: 572 ÷ 364 ≈ 1.57; 572 ÷ 136 ≈ 4.2; 572 × 109 Pa ÷ 101,325 Pa ≈ 5.6 million; 13,200 − 273.15 ≈ 12,900 °C; 372 − 295 = 77 GPa and 425 − 343 = 82 GPa (the paper’s “about 80 GPa”). The [110] transition range is from the paper’s text (372 to 425 GPa); its summary table lists 372 to 415 GPa. The graphic is a SciQuest original drawn from the paper’s values. Spotted an error? See our corrections policy.
Discover more from SciQuest
Subscribe to get the latest posts sent to your email.
Leave a comment