

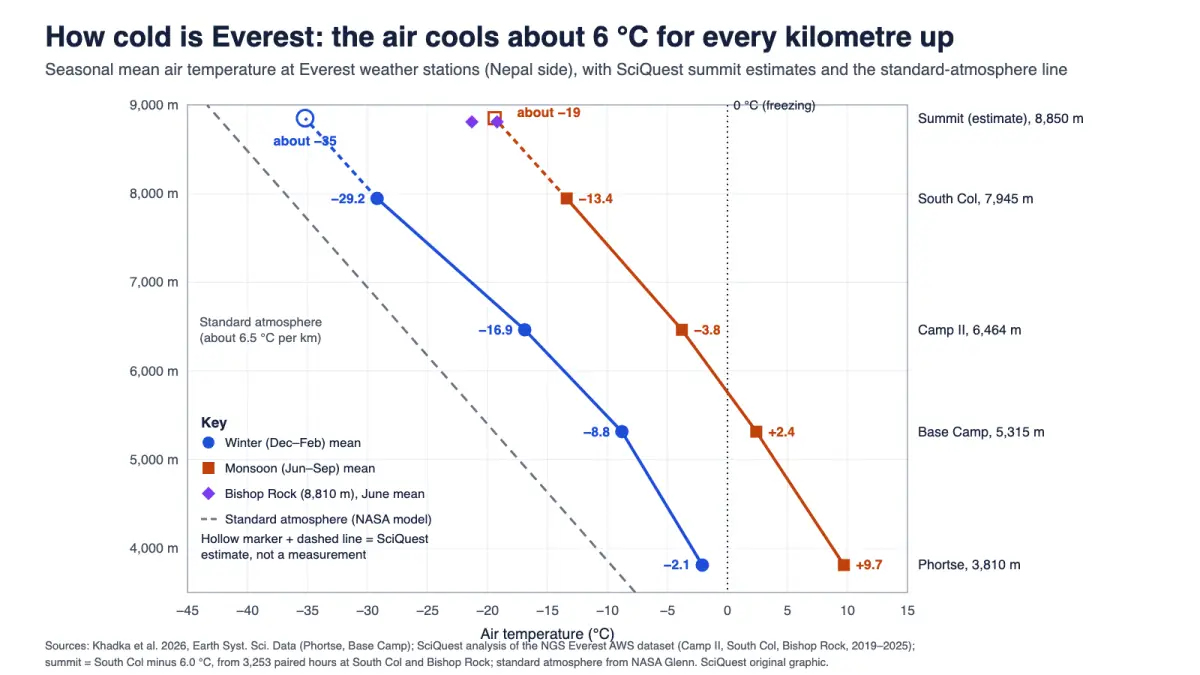
Weather stations on Everest’s Nepal side, the highest just 40 m below the summit, show the air near the top averaging about −35 °C in midwinter and about −18 °C in July, before wind chill is counted.
The summit of Mount Everest averages roughly −35 °C (−31 °F) in midwinter and about −18 °C (0 °F) in July, the warmest month. In May, the main climbing month, it is about −26 °C (−15 °F). These are SciQuest estimates built from the world’s highest weather stations, because no published record covers a full year at the summit itself. The coldest summit air in a weather reanalysis covering 1979 to 2018 was −49 °C (−56 °F).
Wind makes it feel far colder. A study of summit-level conditions found that typical wind chill near the top is below −30 °C all year and around −50 °C in spring. Down at Everest Base Camp (5,315 m), the air averages −8.8 °C (16 °F) in winter and +2.4 °C (36 °F) during the summer monsoon.
Explain it like I’m busy:
- Summit air: about −35 °C in winter, −26 °C in May and −18 °C in July (estimated from stations at 7,945 m and 8,810 m).
- Wind chill near the top: typically around −50 °C in spring, approaching −60 °C in severe storms (Moore and Semple, 2011).
- Why: air cools by about 6 °C for every kilometre you climb on Everest, and the summit sits in thin air with one-third of sea-level pressure.
Key facts about Everest’s temperature
- Highest station: Bishop Rock, at 8,810 m, recorded monthly means of −19.2 °C (June 2022) and −21.3 °C (June 2023). It ran for only parts of two years.
- South Col (7,945 m): the warmest month is July (mean −12.2 °C) and the coldest is February (−29.7 °C), according to the network’s 2026 data paper.
- Base Camp (5,315 m): the yearly mean was −3.1 °C between December 2019 and November 2022.
- Record cold: −49 °C at summit level in ERA-Interim reanalysis data from 1979 to 2018; the coldest hourly mean in the South Col station data was −40.0 °C, on 7 February 2021 (SciQuest analysis).
- Air pressure: the summit averaged 331 hPa from 1979 to 2019, about one-third of standard sea-level pressure (1,013 hPa).
Everest temperatures by season: Base Camp, South Col and summit
| Season | Base Camp, 5,315 m (measured) | South Col, 7,945 m (measured) | Summit, about 8,850 m (SciQuest estimate) |
|---|---|---|---|
| Winter (Dec to Feb) | −8.8 (16) | −29.2 (−21) | about −35 (−31) |
| Pre-monsoon (Mar to May) | −4.5 (24) | −24.4 (−12) | about −30 (−22) |
| Monsoon (Jun to Sep) | +2.4 (36) | −13.4 (8) | about −19 (−2) |
| Post-monsoon (Oct to Nov) | −3.1 (26) | −23.6 (−10) | about −30 (−22) |
| Whole year | −3.1 (26) | −21.8 (−7) | about −28 (−18) |
Sources: Base Camp seasonal means from Khadka et al. (2026), Table 2, for December 2019 to November 2022. South Col values are a SciQuest analysis of the quality-controlled hourly data those authors published (Zenodo record 18849098), averaging every month with at least 80% of hours present between May 2019 and April 2025; one complete May was available. Summit values subtract 6.0 °C from the South Col figure, the average gap we found between the South Col and Bishop Rock stations, scaled to the summit’s height. °F values are converted from the rounded °C values.
What these temperatures mean
A home freezer should run at −18 °C (0 °F), the U.S. Food and Drug Administration advises. On an average July day, the summit of Everest is about as cold as the inside of that freezer. In midwinter it is roughly 17 °C colder still.
The freezer comparison has two limits. A freezer has still air at full sea-level pressure, while Everest’s summit is often swept by jet-stream winds and holds only a third as much air. The summit also gets intense sunshine, so a dark jacket or rock in the sun can be much warmer than the air around it.
Base Camp warms by about 11 °C between winter and the monsoon, and the South Col by about 16 °C. Even so, no month at the South Col or the summit averages above freezing.
How scientists know the temperature at the top of Everest
The first long record came in 2008, when Italian and Nepalese climbers installed a station at the South Col. Kent Moore and colleagues at the University of Toronto used its seven months of data to describe conditions near the top.
In May 2019 a National Geographic and Rolex Perpetual Planet expedition installed five automatic weather stations from Phortse (3,810 m) up to the Balcony (8,430 m). Climatologists Tom Matthews and Baker Perry and 14 Sherpas were among the 22 people on the summit push, carrying 50 kg stations up the Lhotse Face. At the Balcony, drill batteries stopped working in the cold and had to be warmed by body heat before the anchors could go in. The first Balcony reading, just before 06:45 Nepal time on 23 May 2019, was −23.9 °C.
Wind toppled the Balcony station in January 2020. In May 2022 a team returned and installed a new one at Bishop Rock, 8,810 m, the highest station in the network. A power cable failed that summer, so its record covers parts of 2022 and 2023, mostly late spring and early summer. The quality-controlled data from all six stations were published in October 2026 by Arbindra Khadka of Tribhuvan University and colleagues in Earth System Science Data.
Our estimate for the summit
To fill the gaps, we matched every hour when both the South Col and Bishop Rock stations were working: 3,253 hours in 2022 and 2023. On average, Bishop Rock was 5.8 °C colder, which works out to 6.7 °C per kilometre over the 865 m between them. Scaled to the 905 m from the South Col to the summit, that gives a gap of 6.0 °C, which we subtracted from the South Col’s seasonal averages.
The gap is not constant. In May and June it averaged 6.4 to 6.9 °C, while in July it shrank to 3.1 to 4.5 °C. That fits what Matthews and colleagues reported in 2020: the drop in temperature with height becomes shallower once the monsoon arrives. We had almost no winter hours at Bishop Rock, so the winter estimate assumes the pre-monsoon gap holds. If winter air cools faster with height, the true winter summit average would be a little colder than −35 °C.
Why is Everest so cold?
Air gets colder with height because rising air expands as the pressure on it falls, and expanding air cools. For perfectly dry air, the rate is 9.8 °C per kilometre, the figure NOAA’s Storm Prediction Center uses as its benchmark. Moist air cools more slowly, and the real atmosphere usually sits in between.
On Everest, the 2019 to 2022 station data show the air cooling by about 6 °C per kilometre from Phortse to the South Col (Khadka and colleagues report −6.0 and −6.3 °C per km in different parts of their paper). Matthews and colleagues found the Balcony averaged 28 °C colder than Phortse, 4,620 m lower, during 2019. That works out to 6.1 °C per kilometre.
Worked calculation: what the standard atmosphere predicts
Aviation uses a “standard atmosphere”, an idealised average in which temperature falls steadily with height. NASA Glenn Research Center’s version gives the temperature in the lower atmosphere as T = 15.04 − 0.00649 × h, with T in °C and h in metres.
- Height of the summit: h = 8,850 m.
- Cooling: 0.00649 °C/m × 8,850 m = 57.4 °C.
- Temperature: 15.04 °C − 57.4 °C = −42.4 °C (−44 °F).
That is colder than any seasonal average we estimate for the summit, and about 14 °C colder than our yearly estimate of −28 °C. The reason is location. Everest sits at about 28° north, in the warmth of the subtropics, as Matthews and colleagues point out in a 2020 study of summit air pressure. The standard atmosphere describes a cooler, mid-latitude average.
The warmer air also keeps the pressure up. The standard atmosphere predicts 313 hPa at the summit, but the real summit averaged 331 hPa from 1979 to 2019, from 323 hPa in mid-January to 339 hPa in mid-August. Pressure falls faster with height in cold air, so the thinnest summit air arrives in winter.
Thin, dry air holds less warmth
At the summit, about two-thirds of the atmosphere’s mass is below you. With less air overhead, the sky sends less heat back down as infrared radiation. Khadka and colleagues measured the difference: during the monsoon, the highest daily infrared input from the sky stayed below about 250 watts per square metre at the South Col, against more than 350 at Phortse. They link the gap to colder air and probably to less water vapour higher up.
Wind chill on Everest
Wind chill is the still-air temperature that would draw heat from bare skin at the same rate as the actual combination of cold and wind. The formula behind the U.S. National Weather Service’s wind chill chart, in the metric form printed by Moore and colleagues, is:
WCT = 13.12 + 0.621T − 11.37V0.16 + 0.3965TV0.16, with T in °C and V, the wind speed, in km/h.
Worked calculation: the first reading from the South Col
When the new South Col station sent its first message on 22 May 2019, it reported −17.8 °C with a wind of 8.5 m/s. Matthews and colleagues gave the resulting wind chill as −29.8 °C. Here is how that number comes out.
- Convert the wind: 8.5 m/s × 3.6 = 30.6 km/h. Then V0.16 = 30.60.16 = 1.729.
- 0.621 × (−17.8) = −11.05.
- 11.37 × 1.729 = 19.66.
- 0.3965 × (−17.8) × 1.729 = −12.20.
- WCT = 13.12 − 11.05 − 19.66 − 12.20 = −29.8 °C (−21.6 °F).
A wind of only 31 km/h made the air feel 12 °C colder. Try a hypothetical spring summit day at −26 °C with a 54 km/h (15 m/s) wind and the formula gives −44 °C. One caveat: the index assumes wind measured at the standard 10 m height, and the Everest stations sit lower. Moore and colleagues raised their 3 m South Col wind speeds by 50% before using the formula, so published wind-chill figures depend partly on that choice.
What the wind-chill studies found
Moore and John Semple, a surgeon at the University of Toronto, applied wind-chill formulas to a global weather dataset for the area near the summit in a 2011 paper. Typical wind chill there was below −30 °C in every month. In the spring climbing season, about −50 °C was typical; during severe storms it approached −60 °C, values that are typical in winter.
The same studies estimated a “facial frostbite time”, the time in which exposed facial skin could freeze. Near the summit it was under 20 minutes all year, about 5 minutes in spring and close to 1 minute in severe storms. At the South Col in 2008, the daily average was about 23 minutes in May, 136 minutes in July and 9 minutes in October. These are model estimates for bare skin, published for researchers; they are not a guide for planning a climb.
What changes the answer
Season. The monsoon brings the warmest air, from June to September, and the coldest months are December to February. Wind changes with the seasons too: at the South Col in 2008, the median wind speed was 20 m/s in October against 2.4 m/s in August.
Time of day. At the South Col, the average gap between the day’s lowest and highest temperature is 10.2 °C in July. In February it is only 4.4 °C.
Passing storms. Large weather systems push pressure, temperature and wind around from week to week outside the monsoon. At the South Col in October 2008, wind chills as low as −50 °C were possible at any time of day.
Sensors in the sun. The station shields are not fan-ventilated, and the data notes warn that temperatures read too warm in calm, sunny conditions. The warmest Bishop Rock reading, −0.8 °C in July 2023, should be treated with caution.
A warming climate. The station records are still too short to measure a temperature trend at the top.
How Everest’s cold compares
- Antarctica: the coldest air ever measured at a weather station was far colder than anything recorded on Everest. Our explainer on the coldest place on Earth covers the Antarctic records.
- Height for height: Everest’s air is warmer than the standard atmosphere at every station height. At Base Camp the model gives −19.5 °C, about 11 °C colder than the winter mean and 22 °C colder than the monsoon mean.
- Upside down: Everest would still be about 2 km under water if you stood it on the floor of the Challenger Deep, as our ocean depth explainer shows.
Why it matters to you
The cooling you feel driving up a hill is the same process that makes Everest cold, about 6 °C per kilometre. On Everest it sets where snow and ice can melt, which matters for glaciers that are a source of fresh water for communities downstream. The station records also let scientists check mountain weather forecasts, which Khadka and colleagues describe as highly uncertain above 6,000 m because so few ground measurements exist to test them.
“But wait…”
If the summit never gets above freezing, can snow on Everest melt? Surprisingly, yes. Matthews and colleagues modelled the energy reaching the snow at the South Col in 2019. In their model, strong sunshine produced around 60 mm of meltwater between May and October, even though not a single hourly air temperature rose above −2.6 °C. They could not rule out a little melting at the summit during the monsoon. Far more snow vanishes there by sublimation, turning straight from ice to water vapour in the dry, windy air.
Related questions
How cold is Everest Base Camp? At 5,315 m on the Nepal side, the seasonal mean runs from −8.8 °C (16 °F) in winter to +2.4 °C (36 °F) in the monsoon, with a yearly mean of −3.1 °C (26 °F).
How cold is Everest in May, when most people climb it? About −26 °C (−15 °F) at the summit by our estimate, with spring wind chills typically near −50 °C.
What is the coldest temperature ever recorded on Everest? The lowest hourly mean in the published station data is −40.0 °C, at the South Col on 7 February 2021. At summit level, a reanalysis put the lowest air temperature from 1979 to 2018 at −49 °C, a modelled value rather than a measurement.
Does sound travel slower in the cold summit air? Yes. In −35 °C air, sound travels at about 309 m/s, roughly 10% slower than at 20 °C. Our speed of sound explainer shows how temperature sets the speed.
In one sentence
The top of Everest is roughly −35 °C in winter and −18 °C in July, about 6 °C colder for every kilometre above the camps below, and its winds can make that feel like −50 °C or worse.
Quick check: did it click?
- About how cold is Everest’s summit in July? Around −18 °C (0 °F), roughly the temperature of a home freezer.
- Why is the summit warmer than the standard atmosphere predicts? Everest lies in the subtropics, where the air column is warmer than the mid-latitude average the model describes.
- Why is the summit temperature an estimate? No station has recorded a full year at the summit; values come from stations at 7,945 m and 8,810 m.
Read next
- What is the coldest place on Earth? The record depends on how you measure it
- How deep is the ocean? Average depth, deepest point and each ocean
- Speed of sound in mph, m/s and km/h
Disclosure: This article was drafted with AI assistance and checked against the sources below. The South Col seasonal averages, the South Col to Bishop Rock temperature gap, the summit estimates, the standard-atmosphere and wind-chill calculations and the unit conversions are SciQuest calculations from the published station data, and the chart is an original SciQuest graphic. This article describes research findings and is not climbing or medical advice. Spotted an error? See our corrections policy.
Sources
- A. Khadka, L. B. Perry, T. Matthews et al. (2026), Weather station data from the Mount Everest region, Nepal: 3810–8810 m above sea level, Earth System Science Data 18, 7253 to 7267 (station heights; Base Camp seasonal means; South Col July and February means; temperature gradients; sky infrared radiation; Bishop Rock installed 2022)
- A. Khadka (2026), NGS Mount Everest AWS Network, Zenodo, CC BY 4.0 (hourly data and station notes used for the SciQuest South Col, Camp II and Bishop Rock analysis)
- T. Matthews et al. (2020), Going to Extremes: Installing the World’s Highest Weather Stations on Mount Everest, Bulletin of the American Meteorological Society 101, E1870 to E1890 (installation; first readings and wind chills; −49 °C reanalysis minimum; 28 °C Phortse to Balcony difference; monsoon lapse rates; melt and sublimation)
- T. Matthews et al. (2020), Into Thick(er) Air? Oxygen Availability at Humans’ Physiological Frontier on Mount Everest, iScience 23, 101718 (331 hPa mean; seasonal range; 313 hPa standard atmosphere; subtropical warmth; pressure falls faster in cold air)
- G. W. K. Moore and J. L. Semple (2011), Freezing and frostbite on Mount Everest: new insights into wind chill and freezing times at extreme altitude, High Altitude Medicine & Biology 12, 271 to 275 (abstract: summit-area wind chill and facial frostbite times)
- G. W. K. Moore et al. (2012), Environmental conditions at the South Col of Mount Everest and their impact on hypoxia and hypothermia experienced by mountaineers, Extreme Physiology & Medicine 1, 2 (2008 South Col station; wind chill formula; 50% wind adjustment; daily cycles; frostbite times)
- U.S. National Weather Service, Wind Chill Chart (formula; 33 ft measuring height; face-level wind)
- NASA Glenn Research Center, Earth Atmosphere Model, Metric Units (troposphere temperature equation)
- NOAA Storm Prediction Center, Lapse rates (9.8 °C per km dry benchmark; moist benchmark)
- U.S. Food and Drug Administration, Are You Storing Food Safely? (freezer at −18 °C)
Discover more from SciQuest
Subscribe to get the latest posts sent to your email.
Leave a comment