

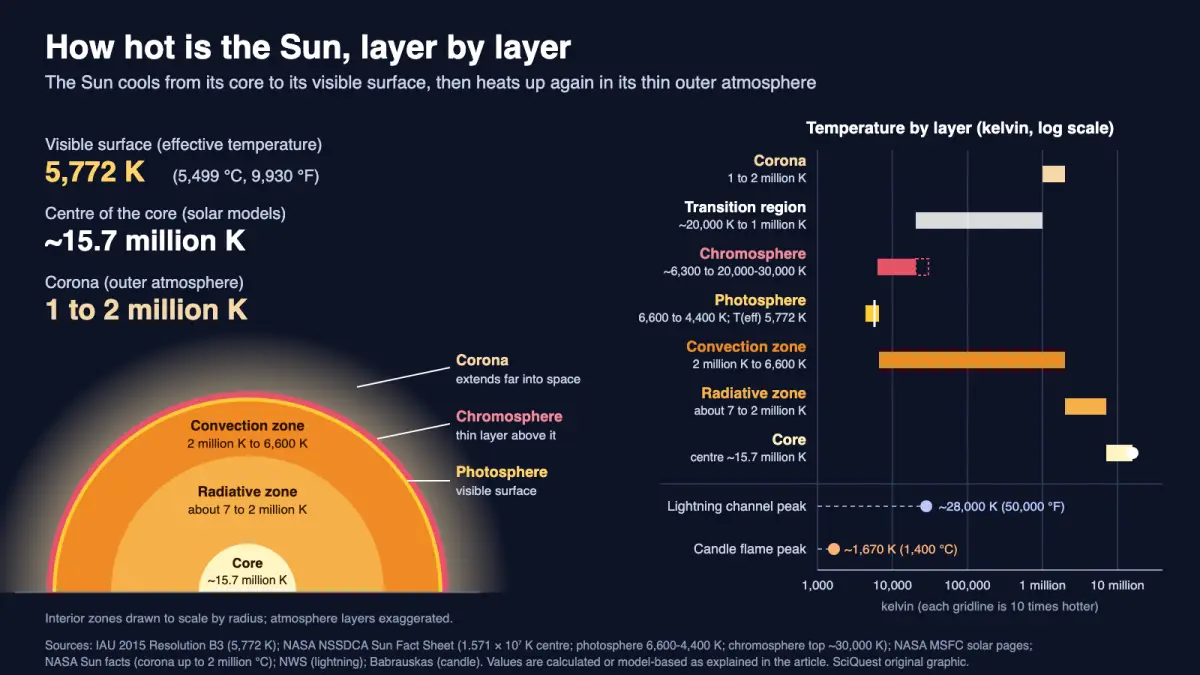
The Sun’s visible surface has an effective temperature of 5,772 K, its centre reaches about 15.7 million K in solar models checked against helioseismology, and its thin outer corona sits at 1 to 2 million K for reasons scientists still debate.
The Sun’s visible surface, the photosphere, has an effective temperature of 5,772 K (5,499 °C or 9,930 °F). Its core is far hotter: about 15.7 million K (roughly 15.7 million °C or 28 million °F) at the centre. The surface value is calculated from the Sun’s measured power output and size, and the International Astronomical Union adopted it as the nominal solar value in 2015. The core value comes from computer models of the solar interior that are tested against sound waves recorded at the surface.
Then there is the twist. Above the surface, the Sun’s thin atmosphere gets hotter again, reaching 1 to 2 million K in the corona. Why that happens is one of the main open questions in solar physics.
Explain it like I’m busy:
- Surface: 5,772 K (5,499 °C, 9,930 °F), calculated from sunlight measured at Earth and the Sun’s radius.
- Core: about 15.7 million K at the centre, from solar models checked with helioseismology.
- Corona: 1 to 2 million K, read from light emitted by iron atoms that have lost many electrons. Nobody has settled how it gets so hot.
Key facts about the Sun’s temperature
- Surface (effective): 5,772 K is the IAU 2015 nominal value; the best estimate is 5,772.0 ± 0.8 K (Mamajek et al. 2015).
- Surface (range): the photosphere runs from about 6,600 K at its base to 4,400 K at its top (NASA NSSDCA).
- Centre: NASA’s Sun Fact Sheet lists 1.571 × 10⁷ K; the Bahcall, Pinsonneault and Basu standard model gives 1.5696 × 10⁷ K.
- Corona: above 1 million °C (NASA Marshall) and up to 2 million °C (NASA), so about 1 to 2 million K.
- Sunspots: their dark centres drop to about 3,700 K, compared with 5,700 K for the surrounding surface (NASA Marshall).
| Layer (inside to outside) | Value as published | Kelvin (K) | Celsius (°C) | Fahrenheit (°F) | How the value is known |
|---|---|---|---|---|---|
| Core, at the centre | 1.571 × 10⁷ K (NASA NSSDCA) | 15.7 million | 15.7 million | 28.3 million | Solar model, tested by helioseismology |
| Radiative zone (25% to 70% of the radius) | 7 million °C falling to about 2 million °C (NASA MSFC) | about 7 million to 2 million | about 7 million to 2 million | about 12.6 million to 3.6 million | Solar model |
| Convection zone (outer 30% of the radius) | about 2 million °C at its base (NASA MSFC), falling to the surface value | about 2 million to 6,600 | about 2 million to 6,327 | about 3.6 million to 11,420 | Solar model, tested by helioseismology |
| Photosphere (visible surface) | 6,600 K at the bottom, 4,400 K at the top (NASA NSSDCA) | 6,600 to 4,400 | 6,327 to 4,127 | 11,420 to 7,460 | Spectra and models of the solar atmosphere |
| Photosphere, single summary value | 5,772 K effective temperature (IAU 2015) | 5,772 | 5,499 | 9,930 | Calculated from luminosity and radius |
| Sunspot dark centres | about 3,700 K (NASA MSFC) | 3,700 | 3,427 | 6,200 | Observed against the brighter surface |
| Chromosphere | 6,000 °C rising to about 20,000 °C (NASA MSFC); about 30,000 K at its top (NASA NSSDCA) | about 6,300 to 20,000 to 30,000 | about 6,000 to 20,000 to 29,700 | about 10,830 to 36,030 to 53,540 | Spectra |
| Transition region | about 20,000 °C rising to 1,000,000 °C (NASA MSFC) | about 20,000 to 1 million | about 20,000 to 1 million | about 36,000 to 1.8 million | Ultraviolet spectra from space |
| Corona | above 1 million °C (NASA MSFC); up to 2 million °C (NASA) | about 1 million to 2 million | about 1 million to 2 million | about 1.8 million to 3.6 million | Emission lines of highly ionised iron |
Sources: IAU 2015 Resolution B3 (Mamajek et al. 2015); NASA NSSDCA Sun Fact Sheet; NASA Marshall Space Flight Center solar physics pages; NASA Sun facts. Conversions are SciQuest calculations: °C = K − 273.15 and °F = °C × 1.8 + 32. Above about 1 million degrees, the 273-degree gap between kelvin and Celsius is smaller than the rounding, so the two columns match. Values marked “about” are rounded by the source.
What 5,772 K and 15.7 million K mean
Temperature measures how fast particles move. At 5,772 K the gas at the Sun’s surface is far hotter than any flame on Earth: a candle’s hottest point reaches about 1,400 °C, or roughly 1,670 K, according to fire scientist Vytenis Babrauskas. The Sun’s surface is about 3.4 times hotter than that on the kelvin scale.
The output is just as large. Using the Stefan–Boltzmann law, each square metre of a surface at 5,772 K radiates about 63 million watts. That is our calculation, and it is the same law astronomers use in reverse to get the 5,772 K figure.
The core is in a different class. At about 15.7 million K, it is roughly 2,700 times hotter than the surface. Hydrogen nuclei there move fast enough to fuse into helium, which is where the Sun’s energy comes from. That energy does not escape quickly: NASA estimates it takes about 170,000 years to travel from the core to the top of the convection zone.
Here is the picture to keep in mind. Walking away from a campfire, you expect the air to cool, and inside the Sun it does, all the way out to the surface. Step off the surface into the corona, though, and it is as if the air two metres from the campfire were hotter than the flames. The comparison has a limit: a campfire heats the air by burning fuel, but the corona’s heat must arrive from below by a route scientists are still pinning down, and the corona is so thin that it holds very little heat despite its temperature.
How scientists know the Sun’s temperature
The surface: sunlight, size and the Stefan–Boltzmann law
No thermometer has touched the Sun. The surface value is worked out from light, starting with the total solar irradiance: the power of sunlight arriving at the top of Earth’s atmosphere. The IAU’s nominal value is 1,361 watts per square metre, consistent with observations across solar cycle 23.
Spread that over a sphere one astronomical unit (149,597,870.7 km) in radius and you get the Sun’s total power, its luminosity. Then ask what temperature a perfect glowing body the size of the Sun would need to emit that much power. That answer is the effective temperature.
Worked calculation:
- Luminosity: L = 4π × (1.495978707 × 1011 m)2 × 1,361 W/m2 = 3.828 × 1026 W.
- Stefan–Boltzmann law: L = 4πR2σT4, with R = 6.957 × 10⁸ m (the IAU nominal solar radius, 695,700 km) and σ = 5.670 × 10⁻⁸ W m−2 K−4.
- Rearranged: T = (L ÷ 4πR2σ)1/4 = 5,772 K.
Our arithmetic with these inputs gives 5,771.8 K, which rounds to the IAU value. The IAU working group (Mamajek and colleagues) calculated the current best estimate as 5,772.0 K with an uncertainty of 0.8 K.
The same temperature also fits the colour of sunlight. Wien’s law says a perfect glowing body at 5,772 K would emit most strongly at about 502 nanometres, in the blue-green part of the visible spectrum. The Sun is not a perfect glowing body, so this is a consistency check, not the measurement.
The core: sound waves and solar models
Light from the core never reaches us directly, so the core temperature is calculated. Solar models build the Sun from physics: gravity, gas pressure, nuclear fusion rates and how energy moves outward. The model is tuned to match the Sun’s known mass, radius, age and luminosity, and it then predicts the temperature at every depth.
Helioseismology is the check. The Sun rings with sound waves, and the National Solar Observatory’s GONG network, with telescopes at six sites around the world, records the surface motions they cause. The National Solar Observatory says these come from about ten million resonating acoustic waves. Their frequencies reveal how fast sound travels at each depth, which depends on temperature and composition. Bahcall, Pinsonneault and Basu compared their 2001 model’s sound speeds with these observations; that model puts the centre at 1.5696 × 10⁷ K and the bottom of the convection zone at 0.714 of the Sun’s radius.
So the core figure is calculated, not observed. It is trusted because a model built from independent physics matches the measured sound speeds through most of the interior, but it still depends on the model’s assumptions.
The corona: light from iron that has lost 13 electrons
Early observers of the corona’s spectrum found bright emission lines that matched no known element, and some proposed a new gas they called “coronium”, NASA’s Marshall Space Flight Center notes. The lines were later traced to ordinary elements such as iron in a highly ionised state, meaning atoms stripped of many electrons.
That stripping is the thermometer. The famous green coronal line at 530.3 nm comes from Fe XIV, iron missing 13 of its 26 electrons. Its emission peaks at a temperature of about 2 MK, according to a 2008 analysis by Mierla and colleagues in Astronomy & Astrophysics. A red line from Fe X, iron missing nine electrons, peaks at around 1 MK. Gas has to be that hot for collisions to knock off so many electrons, so the lines tell us the temperature.
What changes the answer
Which layer you mean. “The Sun’s temperature” can mean the centre, the surface or the corona, and those differ by a factor of about 2,700. The search answer you want depends on that choice.
Which surface number. The photosphere is a layer of gas, not a hard skin, and its temperature falls from 6,600 K to 4,400 K across it. The 5,772 K effective temperature is a single value that summarises the whole layer’s light.
Rounding and unit conversion. NASA’s Sun facts page gives the surface as about 5,500 °C or 10,000 °F and the core as about 15 million °C or 27 million °F. Those are rounded. Converting the Fact Sheet’s 1.571 × 10⁷ K directly gives 28.3 million °F, so “27 million °F” comes from converting the rounded 15 million °C. Neither figure is wrong, but they are not equally precise.
Where and when in the corona. Coronal temperatures vary with location and solar activity. A 2018 NASA article put the corona at upwards of 2 million °F, while NASA’s Sun facts say up to 2 million °C. Both fall inside the 1 to 2 million K range used here.
Older values. Some books and websites give slightly different surface figures. In 2015 the IAU adopted 5,772 K as a nominal value so that astronomers convert between units the same way. The IAU stresses that nominal values are fixed standards, not the latest best estimates, although here the two agree to within 1 K.
Why is the corona hotter than the surface?
NASA calls the source of coronal heating a major unsolved puzzle. The temperature climbs from thousands of degrees at the surface to millions in the corona, and the rise begins in the chromosphere and transition region, where NASA’s IRIS spacecraft looks for clues.
A 2018 NASA article on Parker Solar Probe describes two chief ideas. One is that waves in the Sun’s magnetic field carry energy up and release it in the corona. The other is that countless small explosions, called nanoflares, dump heat into the solar atmosphere. Neither has been confirmed as the full answer. NASA designed Parker Solar Probe in part to test them by flying through the corona itself.
How it compares
- Lightning: the National Weather Service says lightning can heat the air to 50,000 °F, about 28,000 K, which the NWS describes as five times hotter than the Sun’s surface. That matches the top of the chromosphere, not the core. Our lightning temperature explainer covers how that peak is measured.
- Fire: most flames burn at roughly 900 to 1,400 °C. Even the hottest point of a candle is about 3.4 times cooler than the Sun’s surface in kelvin. Our guide to flame temperatures explains why colour is a poor thermometer.
- The core against lightning: 1.571 × 10⁷ K is about 560 times the NWS lightning figure.
- A spacecraft in the corona: NASA says Parker Solar Probe’s heat shield reaches only about 2,500 °F (about 1,370 °C) while the probe flies through million-degree gas.
Why it matters to you
The 5,772 K surface sets how much sunlight reaches Earth. Together with the Sun’s size and distance, it gives the 1,361 watts per square metre arriving at the top of our atmosphere, the energy behind daylight and solar panels. The corona matters too, because it is now close enough for a spacecraft to visit: Parker Solar Probe flies through it.
“But wait…”
If the corona is a million degrees, why doesn’t Parker Solar Probe melt? Because temperature and heat are different things. NASA’s explanation is that temperature measures how fast particles move, while heat is the total energy they transfer. The corona has an extremely high temperature but very low density, so few particles hit the spacecraft. NASA says the Sun-facing side of the heat shield reaches only about 2,500 °F.
Related questions
How hot is the Sun in Fahrenheit? The surface is 9,930 °F, which NASA rounds to 10,000 °F, while the centre reaches about 28 million °F and the corona sits at roughly 1.8 million to 3.6 million °F.
How hot is the Sun in kelvin? 5,772 K at the surface, about 15.7 million K at the centre and about 1 to 2 million K in the corona.
How hot is a sunspot? About 3,700 K in its dark centre. Sunspots look dark only because the surrounding surface, at about 5,700 K, is brighter.
Is the Sun the hottest thing in the universe? No. Our explainer on what is the hottest thing in the universe covers exploding stars that briefly get far hotter than the Sun’s core.
How big is the Sun compared with Jupiter? It has roughly 1,000 times Jupiter’s volume; our Jupiter vs the Sun comparison explains the maths.
In one sentence
The Sun’s visible surface has an effective temperature of 5,772 K (5,499 °C, 9,930 °F), calculated from its measured light and size, while its centre reaches about 15.7 million K in tested models and its thin corona sits at 1 to 2 million K for reasons scientists are still working out.
Quick check: did it click?
- What is the Sun’s surface temperature in kelvin, and how is it worked out? 5,772 K, calculated from the Sun’s luminosity and radius with the Stefan–Boltzmann law.
- Has anyone measured the core temperature directly? No. About 15.7 million K comes from solar models checked against helioseismology.
- Which is hotter, the surface or the corona? The corona, at 1 to 2 million K, and the reason is still debated.
Read next
- How hot is lightning? About 30,000 K, five times the Sun’s surface
- The stages of the life cycle of a star
- What is the hottest thing in the universe?
Disclosure: This article was drafted with AI assistance and checked against the sources below. The unit conversions, the effective-temperature and Wien’s-law calculations, the 63-million-watt surface output and the ratios are SciQuest calculations, and the layer chart is an original SciQuest graphic. The candle comparison uses a fire-science review rather than a space agency source. Spotted an error? See our corrections policy.
Sources
- E. E. Mamajek et al. (2015), IAU 2015 Resolution B3 on Recommended Nominal Conversion Constants for Selected Solar and Planetary Properties (nominal 5,772 K, best estimate 5,772.0 ± 0.8 K, 3.828 × 1026 W, 1,361 W/m2, nominal radius)
- NASA NSSDCA, Sun Fact Sheet (1.571 × 10⁷ K centre; photosphere 6,600 K and 4,400 K; chromosphere top about 30,000 K)
- NASA Science, Sun: Facts (core 15 million °C; surface 5,500 °C; corona up to 2 million °C; 170,000 years; coronal heating “a major unsolved puzzle”)
- NASA Marshall Space Flight Center, The Solar Interior (core, radiative zone and convection zone temperatures and extents)
- NASA Marshall Space Flight Center, The Chromosphere, The Transition Region and The Corona (layer temperatures; ultraviolet ions; “coronium”; highly ionised elements)
- NASA Marshall Space Flight Center, Photospheric features (sunspot centres about 3,700 K)
- J. N. Bahcall, M. H. Pinsonneault and S. Basu (2001), Solar Models: Current Epoch and Time Dependences, Neutrinos, and Helioseismological Properties, The Astrophysical Journal 555, 990 to 1012 (central temperature 1.5696 × 10⁷ K; convection zone base 0.714 solar radius; sound speeds compared with helioseismology)
- National Solar Observatory, GONG (six sites; about ten million resonating acoustic waves)
- M. Mierla et al. (2008), Analysis of the Fe X and Fe XIV line width in the solar corona using LASCO-C1 spectral data, Astronomy & Astrophysics 480, 509 to 514 (Fe XIV 530.3 nm peaks near 2 MK; Fe X near 1 MK)
- NASA (2018), NASA’s Parker Solar Probe and the Curious Case of the Hot Corona (waves and nanoflares)
- NASA, IRIS mission page (heating begins in the chromosphere and transition region)
- NASA (2018), Traveling to the Sun: Why Won’t Parker Solar Probe Melt? (temperature versus heat; heat shield about 2,500 °F)
- National Weather Service, How Hot Is Lightning? (50,000 °F)
- V. Babrauskas, Temperatures in flames and fires (candle flame peak about 1,400 °C)
Discover more from SciQuest
Subscribe to get the latest posts sent to your email.
Leave a comment